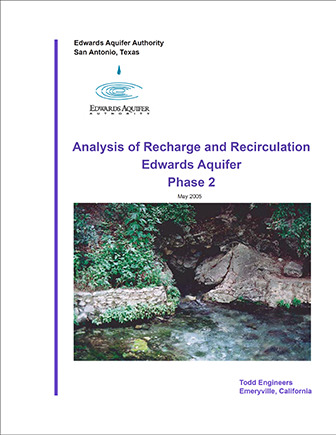
Analysis of Recharge and Recirculation Edwards Aquifer Phase 2

| Summary |
|
The Recharge and Recirculation (R&R) Phase 2 Report focuses on Edwards Aquifer responses to recharge as simulated by the Aquifer MODFLOW model. Using the model, aquifer water levels and springflows were evaluated by simulating recharge events at eight different locations across the project area. Numerous combinations of recharge timing, volume, and location were modeled. No specific source of recharge water was considered during Phase 2 analysis. The report contains numerous graphics to demonstrate the relative benefits of the scenarios modeled. [Excerpted from the Executive Summary] These analyses were conducted with the application of the recently-available USGS MODFLOW model of the Edwards Aquifer (Lindgren, 2004)…. Given the uncertainties associated with the model and the approved scope of work, a series of model runs were devised to analyze the response of the aquifer and springflows to various scenarios of enhanced recharge. … Subsequent model runs used actual estimates for maximum recharge enhancement water under average and drought conditions for the eight recharge sites as summarized by Turner Collie & Braden and LBG Guyton in their 1999 work for EAA (Table 5).,,, Increases in springflow occur quickly in response to recharge because of the rapid transmission of the pressure wave in the aquifer. However, in most cases the actual water molecules that are recharged remain in the aquifer for a long time…. A summary of the preliminary findings of the Phase 2 analyses based on applications of the USGS MODFLOW model are briefly summarized as follows: 1. On a 5-year recharge basis, Comal Springs flow increases by an amount of water equivalent to 45 to 54 percent of water recharged from the Lower Sabinal, Lower Hondo, Lower Verde, San Geronimo, or Cibolo sites. The remaining sites, Indian Creek, Lower Frio, and Lower Blanco, are less effective in terms of benefits to Comal Springs (see Figure 2). 2. A flow increase in Comal Springs resulting from enhanced recharge at an individual site is independent of water recharged at any other site (see Table 2). 3. Year-round recharge yields more uniform springflow than does seasonal recharge (see Figure 8). 4. On a continuing recharge basis, Comal Springs flow increases by 0.9 to 1.1 cfs for each 1,000 AF/yr of enhanced recharge into each of the Lower Sabinal, Lower Hondo, Lower Verde, San Geronimo, or Cibolo sites (see Table 3). 5. Tributary runoffs reaching Indian Creek and Lower Blanco recharge sites are the largest of the eight sites but contribute least to Comal Springs flow (see Table 5). 6. Well J-17 shows an increase in water level of about 0.2 foot for each 1,000 AF/yr of continuous recharge into the Lower Sabinal, Lower Hondo, Lower Verde, or San Geronimo sites. 7. Model results indicate that the observed Comal Springs drought of less than 185 days in 1956 would increase to 1,264 days of no flow under the hypothetical situation of 1950s recharge and 1980s pumpage (see Table 8). If all annual average available recharge were applied to a single site (Lower Verde), the no flow period would be reduced to 512 days, and if DMCPM rules were also in effect, the period would be further reduced to zero days. |
Search for Documents
Advance Search
Explore EAA's Scientific Reports
- All Reports
- RZ Protection
- Aquifer Levels
- Remote Sensing
- Precipitation
- Overview Studies
- Modeling
- Hydrology and Hydrogeology
- History
- Groundwater Recharge, Recharge Zone
- Groundwater Movement
- Geomorphology and Caves
- Weather Modification
- Geology
- Water Use and Conservation
- Geochemistry
- Water Resources Planning and Management
- Floods and Drought
- Water Quality
- Climatology
- Surface Water / Groundwater Relationship
- Biology
- Springs, Groundwater Discharge
- Archaeology
