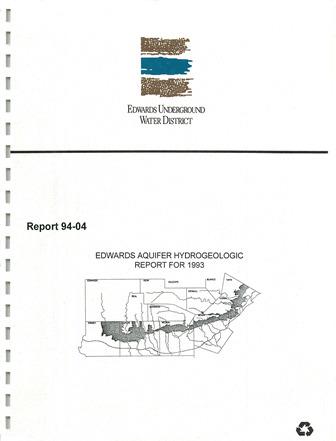
Edwards Aquifer Hydrogeologic Report for 1993

| Author | Walthour SD, Waugh JR, Sutton CM and Bader RW |
| Year | 1994 |
| Description | Annual report for 1993 on recharge, discharge, water levels and water quality in the Edwards Aquifer San Antonio Region |
| Report Number | 94-04 |
| Publisher | Edwards Aquifer Authority |
| Location | Edwards Aquifer - San Antonio Area |
| Cover | View Download |
| File | View Download |
| Summary |
|
The average estimated annual groundwater recharge to the Edwards aquifer in the San Antonio area from 1934 through 1993 was 678,900 acre-feet. Recharge in 1993 was 447,600 acre-feet, which was well below the regional average. The lowest annual recharge of 43,700 acre-feet occurred in 1956 and the highest annual recharge of 2,486,000 acre-feet occurred in 1992. The estimated annual discharge from the Edwards aquifer through wells and springs in 1993 was 996,700 acre-feet, which was the second largest calculated annual discharge for the period of record (1934-1993). The lowest annual discharge through wells and springs for the same time period was 388,800 acre-feet which occurred in 1955. Water level data for wells during 1993 reflected an above average volume of groundwater in storage in the Edwards aquifer during the year. In 1993, the District with the cooperation with the USGS collected water quality samples from 60 wells and three springs. These samples were analyzed for 88 constituents and parameters which included common organic constituents, nutrients, dissolved organic carbon, metals and VOCs. Laboratory analyses indicated that two wells contained levels of iron above the secondary MCL and one well had a concentration of manganese above the secondary MCL. In addition, 11 out of 191 samples contained detectable concentrations of metals. These concentrations were well below the MCLs for those constituents. No detectable concentrations of pesticides were measured in the wells sampled in 1993. VOCs were detected in one well at a level well below the MCLs for the contaminants. VOC concentrations at levels ranging from 0.2 to 0.3 µg/L were encountered in two other wells sampled in 1993, which were below the limits set by current EPA drinking water standards. Results of the District’s 1993 water quality monitoring program illustrate the continued excellent quality of water in the Edwards aquifer. |
Search for Documents
Advance Search
Explore EAA's Scientific Reports
- All Reports
- Precipitation
- Overview Studies
- Modeling
- Hydrology and Hydrogeology
- History
- Groundwater Recharge, Recharge Zone
- Groundwater Movement
- Geomorphology and Caves
- Weather Modification
- Geology
- Water Use and Conservation
- Geochemistry
- Water Resources Planning and Management
- Floods and Drought
- Water Quality
- Climatology
- Surface Water / Groundwater Relationship
- Biology
- Springs, Groundwater Discharge
- Archaeology
- RZ Protection
- Aquifer Levels
- Remote Sensing
