
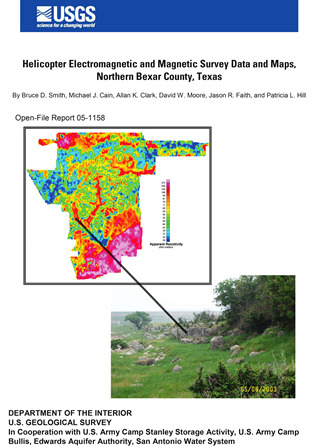
Helicopter Electromagnetic and Magnetic Survey Data and Maps, Northern Bexar County, Texas
| Author | Smith BD, Cain MJ, Clark AK, Moore DW, Faith JR and Hill PL |
| Year | 2005 |
| Description | Helicopter survey of electromagnetic and magnetic properties with hydrologic application around Northern Bexar County, TX |
| Report Number | USGS O-FR 2005-1158 |
| Publisher | US Geological Survey |
| Location | Bexar County |
| Cover | View Download |
| File | View Download |
| Summary |
|
This open-file report is a data release for a helicopter electromagnetic (HEM) and magnetic geophysical survey flown in early December 2003, in Northern Bexar County, Texas (fig. 1). The U.S. Geological Survey (USGS) contracted the survey to Fugro Airborne of Toronto, Canada. Fugro flew a similar survey under contract to the USGS in the Seco Creek area (fig. 1) of the Edwards aquifer (Smith and others, 2003). The objective of these surveys was to collect geophysical data to map and image subsurface features important in understanding ground-water resources in the area (Smith and others, 2003). In particular, the survey has refined the location of mapped faults in the survey area and suggested many unmapped faults exist. These faults can control ground-water flow and storage. New lithologic variations in the Edwards Recharge were mapped in both the shallow and deep subsurface. Images of the subsurface in the confined zone demonstrated a structural complexity not previously appreciated. Geophysical mapping in the Trinity aquifer also showed previously unmapped structures and lithologic variations. The success of the airborne geophysical work at Seco Creek (Smith, Irvine, and others, 2003) led to a meeting of USGS and Camp Stanley Storage Activity (CSSA, Brian Murphy) personnel organized by Parsons Technology (Gary Cobb) to evaluate the possible use of airborne geophysical methods at that site. The area of the CSSA, about 10 square miles, is considerably smaller than the Seco Creek survey area of 80 square miles. Consequently, the general cost per line mile for this small area was estimated to be a factor of 4 to 5 times higher than for the larger area of the Seco Creek survey. A proposal was submitted to the Camp Bullis environmental group to expand the survey area to include the military training site adjacent to CSSA. The USGS also submitted a funding proposal to the San Antonio Water System (SAWS) to fly the Cibolo Creek area north of the military sites and a proposal to the Edwards Aquifer Authority to fly the Edwards recharge area to the south. All of the proposals, in addition to the CSSA proposal, were at least partly funded. The resulting survey consisted of about 800 line miles (1,280 line kilometers) of HEM flying with a major portion of the area being Camp Bullis. A major constraint in flying the areas adjacent to the military sites and northern Bexar County is that urbanization of the city of San Antonio is rapidly expanding to the north, thus restricting low-level flying. An important reason for the project to map and to understand the subsurface Edwards aquifer is that it is the sole-source water supply for the city. As the city development expands northward in Bexar County, less area will be available for low-level aerial surveying including geophysics. A detailed map of survey boundaries is shown in figure 2. Geophysical Survey Summary The HEM survey used the RESOLVE© system flown by Fugro Airborne Surveys, which uses five horizontal coplanar coils and one vertical coaxial coil for electromagnetic field measurements. Appendix I, the contractor’s report, gives details of the instrumentation and data processing procedures. The specific frequencies for the electromagnetic system are given in table 1. These frequencies are similar to those used in the Seco Creek survey except for the highest frequency that was nominally 100,000 Hz. The geophysical sensor housing (“bird”) includes the electromagnetic (EM) system, a total field magnetometer, differential kinematic Global Positioning System (GPS) and laser altimeter. The helicopter carries another differential GPS system, barometric and radar altimeters, and a video camera. Electromagnetic noise from power lines and natural sources (lightning) also are measured. The survey was flown with east-west flight lines and a nominal line spacing of 200 m with a sensor elevation of 30 m except as required for safety considerations and FAA regulations. In-fill lines were flown in the central part of the survey area to yield an effective flight line spacing of 100 m. Lines were also flown down Salado and Lewis Creeks (see cover photo) for additional resolution along drainages. North-south tie lines were flown to level the total field magnetic data…. Data-Release Summary The digital data are described in detail in the following sections and in the contractor report (Appendix I). The data are organized into separate subdirectories in this data release. The subdirectories contain “readme” files describing the files in that directory. Table 2 is a summary of these directories with active links. The geographic data are referenced to NAD27, UTM14N unless otherwise specified. The line data in the “LINEDATA” directory are given in a Geosoft OASIS MONTAJ© database. A free data viewer is available from Geosoft (www.geosoft.com accessed 2/04/05) that can be used to convert the files to ASCII. Files given in the GRIDS subdirectory for the digital magnetic data, apparent resistivity data, and digital terrain model data (derived from the laser altimeter and GPS systems) can be read in the free viewer. Also included is a plug-in (SOFTWARE subdirectory) provided by Geosoft for ESRI programs such as ARCGIS (8.2 and higher) that reads Geosoft grids. The digital maps are all referenced to NAD27, UTM14N…. The airborne geophysical project for northern Bexar County includes an interpretational component. A report on results of this part of the study is in progress. Preliminary comparison of the new geophysical maps with the published geologic maps (A.K. Clark; 2003, 2004) show that the airborne survey provides new information about the location of structures and near surface lithologic variations.The apparent resistivity maps at the 6 survey frequencies provide a rough estimate of conductivity variations as a function of depth. The geophysical data suggest that 1) northwest trending structures that cross the northeast trend of the Balcones fault system are more extensive than currently mapped (A.K. Clark, 2003), 2) apparent resistivity trends in the Edwards recharge zone suggest possible lithologic or structural variations that have not been mapped, 3) the apparent resistivity data from the highest frequency (115,000 Hz) has trends that closely follow the mapped geology and suggest lithologic variations not previously mapped, and 4) differences in the lithologies of the Trinity and Edwards aquifers imply possible constraints in location of subsurface ground water flow paths. All of these preliminary interpretational observations suggest that further processing of the electromagnetic data will be useful in refinement of subsurface geologic and hydrologic features. Processing which is under way includes screening of areas affected by power line noise, and construction of resistivity depth sections (cross sections of resistivity variations) along each flight line. |
Search for Documents
Advance Search
Explore EAA's Scientific Reports
- All Reports
- History
- Groundwater Recharge, Recharge Zone
- Groundwater Movement
- Geomorphology and Caves
- Weather Modification
- Geology
- Water Use and Conservation
- Geochemistry
- Water Resources Planning and Management
- Floods and Drought
- Water Quality
- Climatology
- Surface Water / Groundwater Relationship
- Biology
- Springs, Groundwater Discharge
- Archaeology
- RZ Protection
- Aquifer Levels
- Remote Sensing
- Precipitation
- Overview Studies
- Modeling
- Hydrology and Hydrogeology