
 Aquifer Conditions
Science & Data Document Library
Science and Data Resources
Groundwater Quality Monitoring Plan Edwards Aquifer Authority
Description: Groundwater quality management plan for the Edwards Aquifer Authority 2003-2006
Location: Edwards Aquifer Authority Jurisdiction
Summary:Water quality data provide the primary indicator of the state of water quality in the Edwards Aquifer, and are a key component in assessing its general condition. Water quality samples also provide the primary source of data for understanding and monitoring contaminant loading and migration in the Aquifer. This plan includes sections on data quality objectives (DQOs), sampling programs, analytical methods, field procedures, activities of other agencies, and guidelines for annual plan review.
The purpose of this plan is to provide a guidance document that ensures useful, consistent and defensible water quality data are produced by implementing appropriate procedures and methods when collecting and analyzing water quality samples. Water quality samples are currently collected under five sampling programs at the Edwards Aquifer Authority (the Authority). Data quality requirements vary by program and are discussed in Sections 2 and 3. The water quality sampling programs currently undertaken by the Authority are:
*Routine Water Quality Sampling
*Event Sampling
*Surface Water Sampling
*Spring Sampling
*Confirmation Sampling
The purpose of this plan can be achieved by implementation of the objectives listed below and discussed in detail herein. Each staff member charged with the responsibility of collecting water quality samples should be familiar with this plan, and the objectives and procedures outlined in it. The objectives of this plan are:
*Obtain quality data that are defensible for their intended purpose.
*Analyze field samples in an appropriate and consistent manner such that the results are accurate, and repeatable.
*Collect samples for laboratory analysis in an appropriate and consistent manner that will ensure accurate and reliable analytical results with a minimal amount of anomalous data.
*Select sample sites and time periods that will provide representative water quality data, for a range of aquifer conditions.
*Review and revise the plan on an annual basis as needed.
San Antonio Regional Water Resource Study-Summary
Description: Non-technical discussion of various alternatives for ensuring water supply for the greater San Antonio region through 2040, a 60-year horizon. Note: This report is included for its historical value and may have been superseded by more recent studies.
Location: Uvalde County, Medina County, Bexar County, Comal County, Hays County
Summary:Note: This report is included for its historical value and may have been replaced by more recent studies.
Continued long-term availability of water from the Edwards Aquifer requires both a technical knowledge of the quantity it can supply, and an understanding of the inseparability of quantity and the quality of the water in the Aquifer. Protection of quality is of primary importance to the future of the Region. Present efforts directed toward water quality protection must be continued and must be intensified if necessary. The Regional Study and this implementation effort have as their focus and intent the achievement of a Regional consensus on those measures and actions required to provide the Region's water users with an adequate long-term water supply of high quality. To this end, the study set out to provide a report that will:
*Enable reasonable people to make responsible decisions concerning public and private investments in the water resources of the Region,
*Insure that those decisions are consistent with regional economic development and environmental integrity and
*Inspire long-term confidence in these decisions.
The Regional Study has provided a framework to solve these regional problems:
*Provide an adequate and reliable water supply for a population expected to grow from 1.1 million people in 1980 to 3.2 million people in 2040.
*Meet short and long term water demands even when droughts occur.
*Protect water quality in the Edwards and the stream systems both from direct pollution and from movement of poor quality water into the Aquifer during periods of prolonged overpumping.
*Share water resources and costs for their development and use fairly among all purposes and parts of the Region.
*Recognize primary uses of water as they differ from East to West in the Region and permit choices of solutions that are tailored to fit needs and preferences of each area.
*Avoid crisis decisions whether forced by droughts, floods, or recessions.
*Retain control of costs and choices of resource allocation at the most appropriate local level.
*Maintain flexibility over time to respond properly to changing conditions as the people in the Region choose.
*Avoid committing either money or resources before they are needed for recognized and agreed purposes.
*Retain management control of decisions at the most local level of government appropriate.
Preliminary Feasibility Assessment of Edwards Aquifer Saline Water Treatment and Use
Description: Feasibility of desalination from the Edwards Aquifer for public drinking water
Report Number: SwRI Report CNWRA-EAA-01
Location: Edwards Aquifer, Balcones Fault Zone, San Antonio Segment
Summary:The Edwards Aquifer is the primary source of water for more than one million people in and near San Antonio, Texas, and supplies potable water as well as water for agricultural, industrial, and recreational purposes throughout an 8,000-square-mile area of south-central Texas. In the last five decades, increased population growth and water demand in San Antonio and surrounding areas have resulted in dramatic increases in average pumping from Edwards Aquifer wells. Water resource planners project that by the year 2020, demand for water in the Edwards Aquifer region could be 863,000 acre-feet per year. Water authorities and other entities in the Edwards Aquifer region, as well as in other parts of Texas, are concerned about potential shortfalls in future water supplies relative to future needs. For example, the 2002 Texas State Water Plan warns that about 900 cities and water user groups in Texas could face water shortages during droughts within the next fifty years unless demand for water is reduced and/or additional water sources are developed. In response to these concerns, public and private entities in Texas are evaluating and implementing desalination projects as alternative water sources. Desalination is a process that removes substances and minerals from brackish (or saline) ground and surface water, or seawater. Desalination is recommended in the 2002 State Water Plan as a water management strategy to produce additional water supplies in several regions of Texas, including the south-central Texas region. The technology is particularly promising for the Edwards Aquifer region because of the presence of an extensive saline-water zone in the Edwards Aquifer, downdip of the fresh water zone. The saline-water zone has not been tapped as a water source due to the high dissolved solids concentration (1,000 to over 10,000 mg/L), but it has the potential to be an important source of water if desalination technology becomes an economically viable choice.
As demand for water in the Edwards Aquifer region starts to exceed the availability of fresh water from the aquifer, desalination of water pumped from the saline-water zone likely will become increasingly important. This document was prepared for the Edwards Aquifer Authority and presents a preliminary study on the feasibility of pumping and treating saline water from the Edwards Aquifer to produce potable water. The report provides background technical information on reverse osmosis (RO) and electrodialysis reversal (EDR)-the dominant desalination technologies for municipal water treatment plants, and summarizes information on existing and planned municipal water treatment plants employing similar technologies. Preliminary cost curves are calculated for the treatment of saline waters as a function of operating parameters. The estimated costs are compared with cost data from existing plants and with estimated costs taken from the literature or provided by a vendor. In addition, preliminary estimates of potential yield from wells that may tap the Edwards Aquifer saline-water zone are made to determine if sufficient saline water could be drawn from the aquifer for use as feedwater for the desalination facility.
Investigation of Volatile Organic Compounds in Groundwater Uvalde, Texas Edwards Underground Water District Field Activities from January 1984 through April 1988
Description: Survey of groundwater to determine the source of tetrachloroethylene (PCE) in the Edwards Aquifer near the Uvalde, TX airport
Location: Edwards Aquifer - Uvalde Area
Summary:The Edwards Underground Water District (EUWD) has been involved in an investigation to determine the source of volatile organic compounds (VOCS) in the Edwards aquifer in the Uvalde, Texas area (fig. 1). Existing Edwards aquifer wells were used to trace voc contamination up the hydraulic gradient in a west-northwest direction from the point of initial discovery to an area where highly contaminated wells exist. Wells further up the hydraulic gradient and in a distinct area around the contaminated area are free of VOC contamination. A monitor well drilling and sampling program was employed to better define the source area. Surface and subsurface geophysical techniques were used to reinforce monitor well data and further delineate a source area.
From September 1983 through February 1984 the u.s. Geological Survey (USGS) collected water samples from selected wells to provide baseline data on volatile organic compounds (VOC) in the Uvalde area. The samples were collected under a cooperative contract with the EUWD. Most samples were collected from public supply wells, however, some samples were collected from private wells. In February 1984 five wells were sampled for VOCs in the Uvalde area (see Appendix B for details of all sampling events).
The only VOC found was tetrachloroethylene (PCE) at a level of 6.4 micrograms per liter (ug/l) in a municipal well located at the Uvalde County airport (Garner Field). This VOC contaminated groundwater sample prompted further investigation.
To verify contamination in the vicinity of the municipal airport two sampling events were conducted in April and August, 1984. A total of eight wells were sampled including the airport well. Of the eight wells four showed PCE contamination.
Four wells drawing water from the Edwards aquifer were polluted with the same compound. This was sufficient evidence to rule out contamination by well construction materials or laboratory error. At this point it was reasonable to assume the volatile organic compound tetrachloroethylene (PCE) existed in the Edwards aquifer in the vicinity of the municipal airport.
Water Quality at Selected Locations in the San Antonio Area, Texas: Progress Report, 1972
Description: Results of water quality testing at selected sites in the Edwards Aquifer from September 1969 August 1971
Location: Edwards Aquifer Balcones Fault Zone San Antonio Segment
Summary:The U.S. Geological Survey, in cooperation with the Edwards Underground Water District and the Texas Water Development Board, is conducting a continuing investigation of water quality in the aquifer formed by the Edwards and associated limestones in the San Antonio area.
The program was initiated in 1968 to collect historical reference data for determining changes in water quality and to detect any current pollution of the ground water. Results of the study from August 1968 to August 1969 are reported by Reeves and Blakey (1970) .
This report includes water-quality data collected from September 1969 to August 1971 and some data from selected analyses made prior to 1969.
Chemical and Bacteriological Quality of Water at Selected Sites in the San Antonio Area, Texas February 1975-September 1977
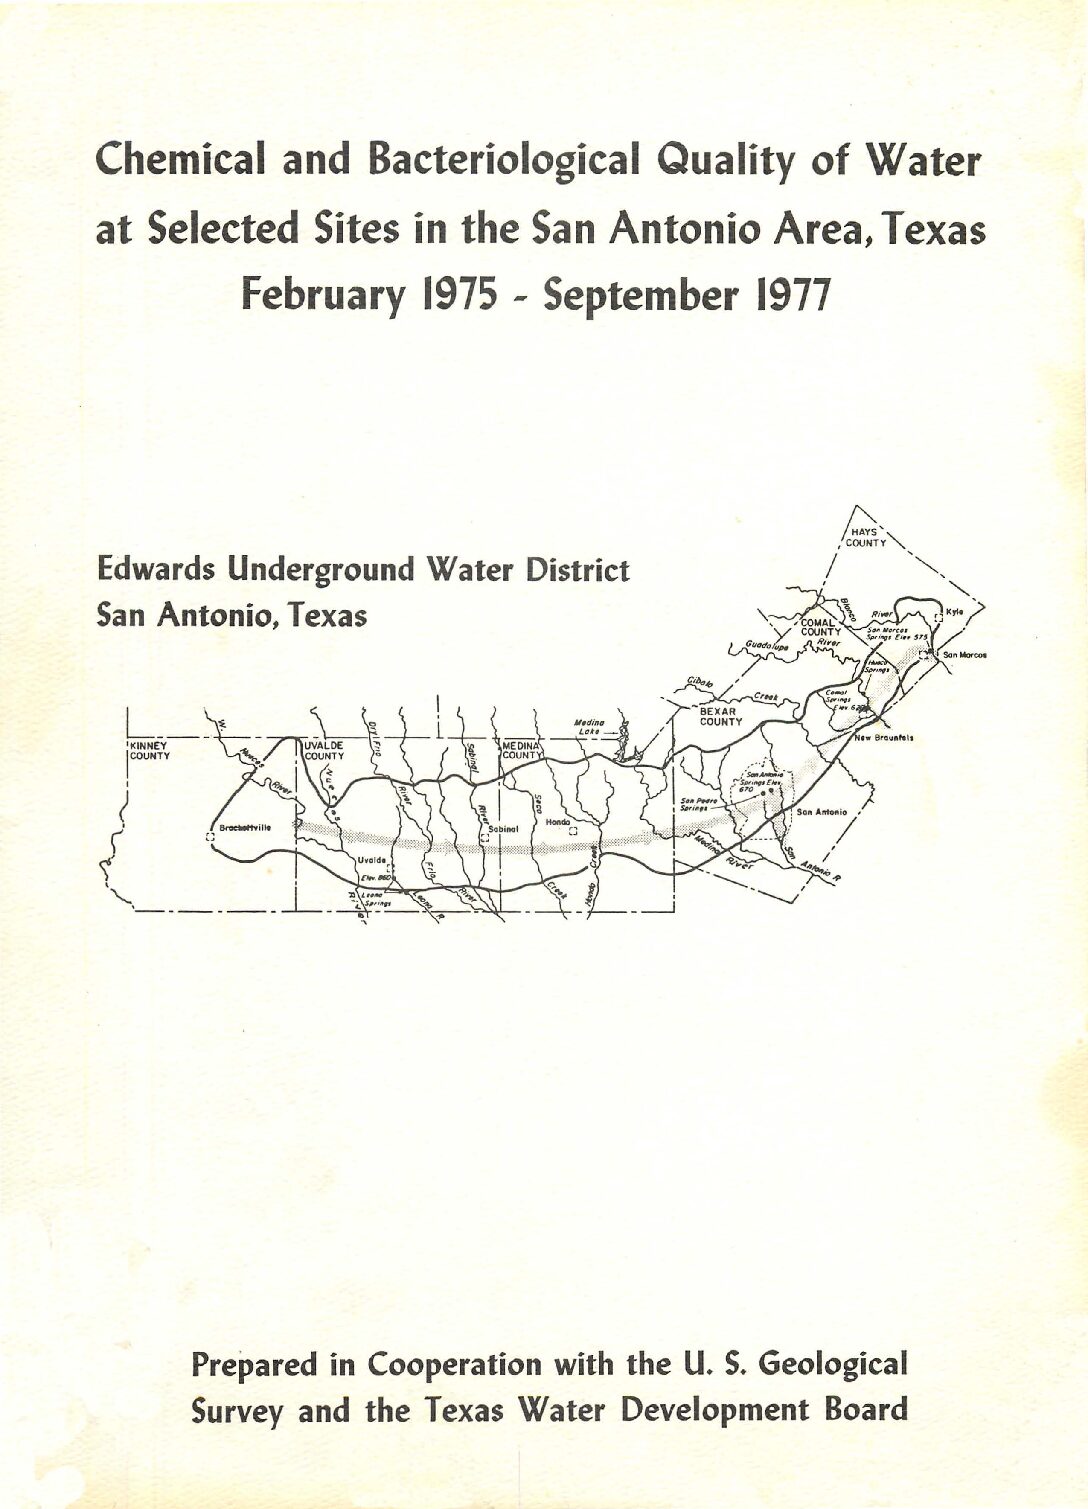
Description: Surface and groundwater quality monitoring in the San Antonio area, 1975-1977. Note: Page-size and full-size plate are at the end of the document.
Location: Edwards Aquifer, Balcones Fault Zone, San Antonio Segment, and associated surface water
Summary:Water samples collected from 79 wells and 3 springs in the Edwards aquifer were analyzed for more than 50 properties or constituents, most of which affect the suitability of the water for domestic use. The samples were analyzed for bacteria; major inorganic constituents; minor elements, including heavy metals; and pesticides.
Water quality of the Edwards Aquifer and streams recharging the aquifer in the San Antonio region, Texas (Map)
Description: Low-resolution maps and discussion of water quality in the Edwards Aquifer Balcones Fault Zone San Antonio Segment. Note: file size for full-size maps is too large.
Report Number: USGS Hydrologic Investigations Atlas HA-723
Location: Edwards Aquifer Balcones Fault Zone San Antonio Segment
Summary:Low-resolution maps and discussion of water quality in the Edwards Aquifer Balcones Fault Zone San Antonio Segment. Note: file size for full-size maps is too large.
Chemical and Bacteriological Quality of Water at Selected Sites in the San Antonio Area, Texas August 1968-January 1975
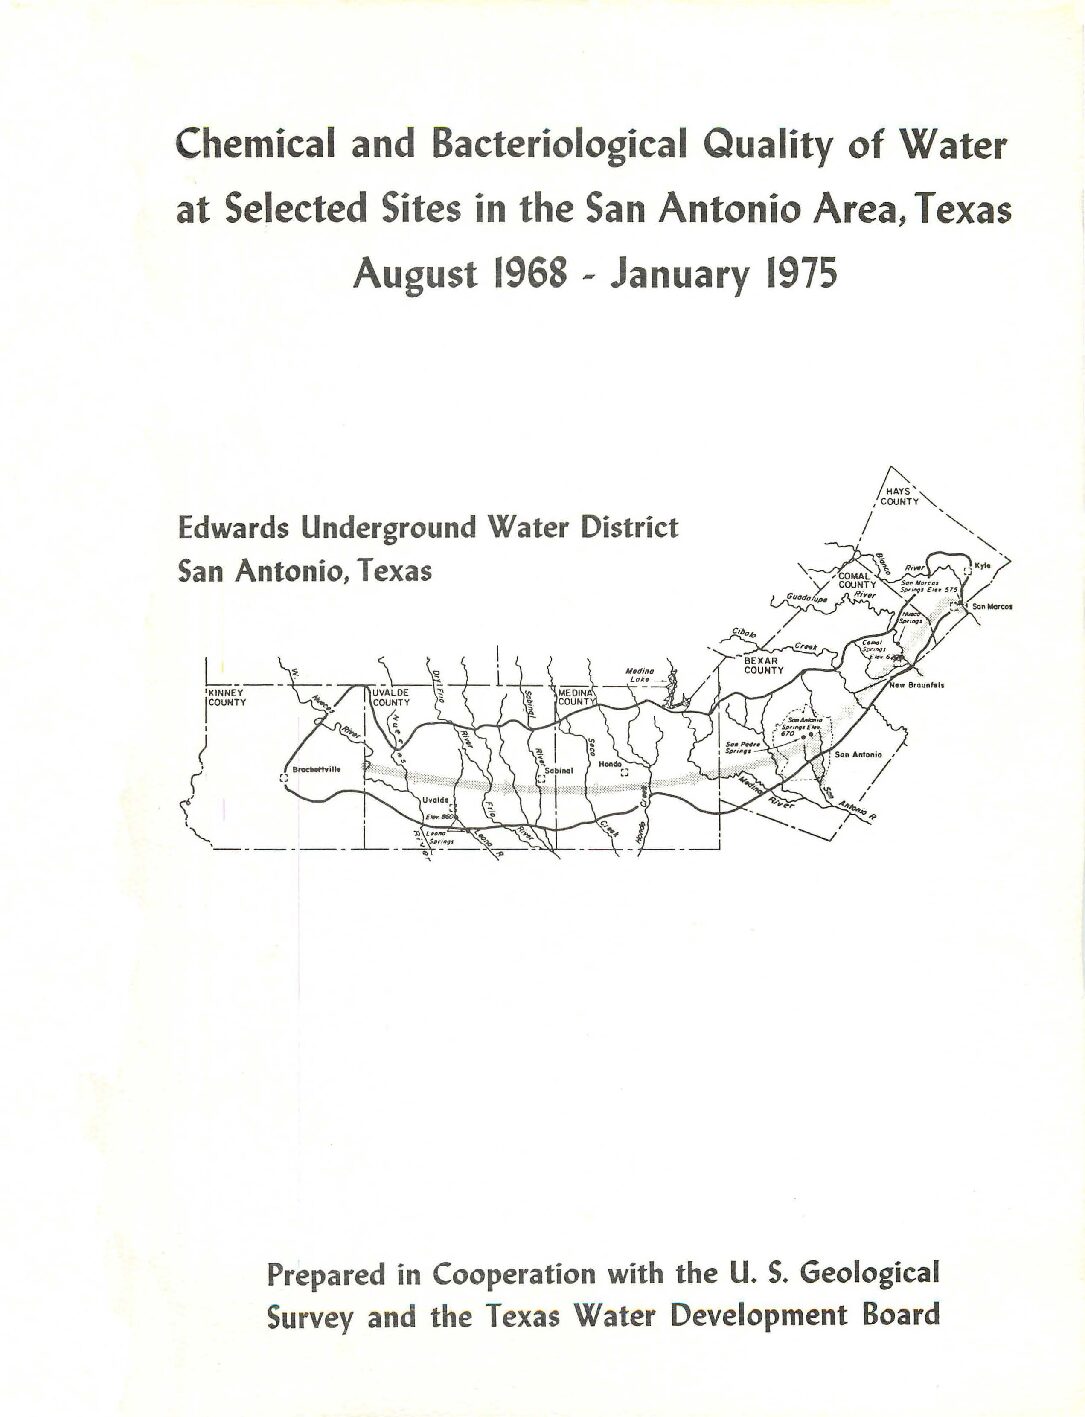
Description: Surface and groundwater quality monitoring in the San Antonio area, 1968-1976. Note: Page-size and full-size plates are at the end of the document.
Location: Edwards Aquifer, Balcones Fault Zone, San Antonio Segment, and associated surface water
Summary:Water samples collected from 161 wells and 3 springs in the Edwards aquifer and at 36 sites on streams that cross the recharge zone of the aquifer were analyzed for more than 50 properties or constituents, most of which affect the suitability of the water for domestic use. The samples were analyzed for bacteria; major inorganic constituents; minor elements, including heavy metals; pesticides; and several other properties or constituents.
None of the concentrations of major inorganic constituents, minor elements, or pesticides exceeded the U.S. Environmental Protection Agency's maximum contaminant levels for public water systems or maximum.acceptable limits for raw water used for drinking-water supplies. The concentrations of dissolved solids in samples from wells and springs ranged from about 200 to 527 mg/l (milligrams per litre) and the dissolved chloride and dissolved sulfate concentrations ranged from 3.7 to 130 mg/l and from 0.0 to 83 mg/l, respectively. The total nitrite plus nitrate nitrogen and total phosphorus concentrations in the ground water ranged from 0.00 to 5.5 mg/l and from 0.00 to 0.12 mg/l. The water is very hard (greater than 180 mg/l as calcium carbonate) and is of the calcium bicarbonate type.
The recharge zone or water-table part of the aquifer is characterized by areas of thin soils or bare rock, and the aquifer is susceptible to contamination in these areas. The presence of fecal coliform and fecal streptococci bacteria, the variations in the number of total coliform bacteria, and the concentrations of total nitrite plus nitrate nitrogen and total phosphorus in samples from some wells in the water-table part of the aquifer show that contamination can and does occur. However, the data indicate that such contamination at the present time (1976) is very localized, and is small in comparison to the volume of water available for dispersion and dilution. In the artesian zone of the reservoir, samples from improperly constructed wells have contained coliform bacteria; but samples collected from properly constructed and sealed wells were free of coliform bacteria.
There is no evidence of significant degradation of water quality throughout most of the ground-water reservoir, but the data collected during this study indicate that the nearly unrestricted movement of liquids· from the surf ace to the aquifer in the recharge zone presents an ever-present hazard if surface spills of toxic substances should occur. In addition, the many poorly-constructed wells in the artesian part of the aquifer could allow toxic substances to enter the aquifer.
Chemical and Bacteriological Quality of Water at Selected Sites in the San Antonio Area, Texas August 1968-April 1972
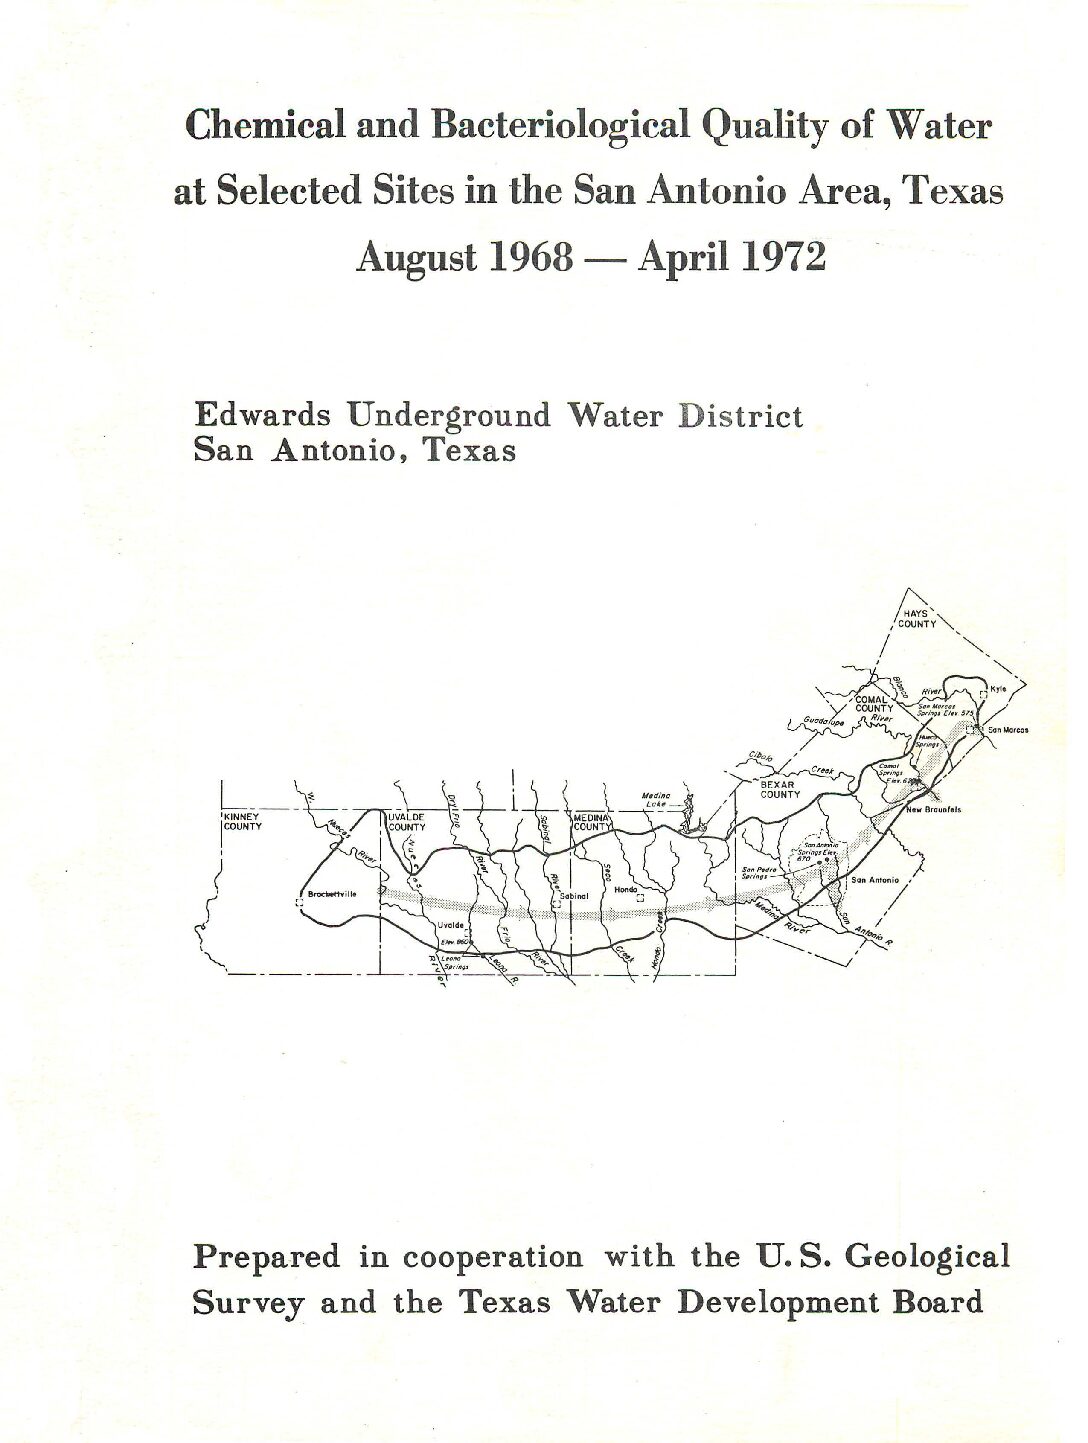
Description: Surface and groundwater quality monitoring in the San Antonio area, 1968-1972
Location: Edwards Aquifer, Balcones Fault Zone, San Antonio Segment, and associated surface water
Summary:Urban development on or adjacent to the recharge zone of the Edwards aquifer is causing concern about the possible pollution of ground water in the aquifer, which is the principal source of water supply for the San Antonio area. Water-quality data for many wells and springs and for selected sites on streams that cross the recharge zone of the aquifer are being collected to provide background information and to detect any current pollution of ground water in the area.
Water from the Edwards aquifer is very hard and of the calcium bicarbonate type. The concentrations of dissolved solids in samples from wells and springs ranged from about 200 to 470 mg/1 (milligrams per liter); the chloride and sulfate concentrations ranged from 6.5 to 62 mg/1 and from 0.0 to 65 mg/1, respectively. The nitrate and phosphate contents of the ground water ranged from 0.0 to 15 mg/1 and from 0.00 to 0. 37 mg/1.
The concentrations of these and other constituents show that the chemical quality of water in the Edwards aquifer has not been degraded significantly by domestic, industrial, or agricultural effluents.
However, variations in the number of coliforms, the concentrations of nitrate and phosphate, and the presence of fecal coliforms and fecal streptococci in samples from some wells show that fecal pollution is reaching the aquifer.
Most of these wells, which are located in or just downdip from the recharge zone, are poorly sealed or inadequately cased. The areal variation in the locations of these wells indicates that pollution of ground water in the aquifer is very localized. Pollution results principally from runoff from the land surface and from effluent from septic tanks which enters the aquifer through fractures in the recharge zone or which infiltrates through the thin soil into poorly sealed or inadequately cased wells in or adjacent to the recharge zone.
Trace amounts of several pesticides have been detected in samples from two wells in the San Antonio area. Field investigations showed the source of pesticides in these wells to be. surface drainage that entered the wellbores.
Water-quality data collected at sites on streams that cross the recharge zone of the Edwards aquifer show the chemical composition of surface water to be very similar to that of ground water in the area.
Water in most streams is very hard and of the calcium bicarbonate type. Limited data on the bacteriological quality show that coliforms were present at each of the sites sampled and that fecal coliforms and fecal streptococci were present at most sites. Although the number of these bacteria varied greatly in both time and place, their density in samples from most sites were low for untreated surface water.
Analysis of Water Quality Data for East Elm, West Elm and Lorence Creeks
Description: Water quality in three small watersheds in the Edwards Aquifer Recharge Zone in relation to storm water runoff and urbanization, 1976 - 1980
Location: Edwards Aquifer, Balcones Fault Zone, San Antonio Segment, Recharge Zone
Summary:Water quality data collected on East Elm, West Elm and Lorence Creeks were compiled and analyzed. The watersheds of the three streams are characterized by different levels of urbanization. The East Elm watershed is largely undeveloped, while the Lorence Creek basin is almost completely urbanized as a residential area. The West Elm watershed represents an intermediate level of development.
Statistical analysis of the water quality data indicated that mean concentration values of most of the constituents were higher at the Lorence Creek station than at either the East Elm or West Elm sites. Further, mean concentration values at the West Elm station were higher than corresponding values at the East Elm station.
The most apparent factor which may contribute to the observed differences in constituent concentrations is the level of urbanization in the test watersheds. However, additional factors could also contribute, such as physiographic variables and differences in the frequency and duration of stormwater runoff events. On the basis of flow-weighted average concentrations, West Elm Creek displayed the highest values, with no consistent difference evident between Lorence Creek and East Elm Creek.
Several mathematical relationships were examined to investigate correlations between constituent concentration and discharge rate for the three sampling stations. Only poor correlations were evident, indicating that concentrations are not a function of flow rate.
Chemical Analyses of Water from Observation Wells in the Edwards and Associated Limestones, San Antonio Area, Texas, 1967
Description: Chemical analyses of water from 37 wells to define the boundary of the freshwater-saline water interface in the Edwards Aquifer Balcones Fault Zone San Antonio segment in 1967. Note: This report is included for its historical value; results may have been superseded by more recent studies.
Report Number: Bulletin 16
Location: Freshwater/Saline Interface, Edwards Aquifer Balcones Fault Zone San Antonio Segment
Summary:Note: This report is included for its historical value; results may have been superseded by more recent studies.
A program to resample observation wells tapping a zone of transition between water of good quality and saline water in the Edwards and associated limestones was begun in 1959. The chemical analyses of the resampling program are being used to detect possible encroachment of saline water into the fresh-water areas as the head in the aquifer changes. Those analyses compiled through 1966 were published by the Edwards Underground Water District (See references, page 3), and this report presents the chemical analyses compiled during 1967. This program is part of a more extensive hydrologic investigation carried on by the U. S. Geological Survey in cooperation with the Edwards Underground Water District, the Texas Water Development Board, and the city of San Antonio.
Samples are collected for chemical analyses from 37 wells, most of which are sampled twice a year, but some are sampled only once a year because of their limited use. The number of wells was reduced in 1966 from 72 to 37, but the original 72 will be sampled again when water levels drop to those levels near and below the recorded lows.
The well numbers in this report conform to the statewide system used by the Texas Water Development Board (Alexander and others, 1964). The numbers formerly used are listed in parenthesis with each well. The water samples are analyzed in the laboratory of the U.S. Geological Survey in Austin, Texas, for specific conductance, pH, chloride, sulfate, bicarbonate, and hardness. A more complete analysis has been made for one sample from each well, and these analyses are on file in the offices of the Geological Survey in Austin and San Antonio. Locations of wells and other data pertaining to the resampling program may be found in the references.
Conceptualization and Simulation of the Edwards Aquifer, San Antonio Region, Texas
Description: A new ground-flow model for the San Antonio and Barton Springs segments in the San Antonio region. Note: this document is included for its historical value and may have been replace by more recent updates.
Report Number: USGS SIR 2004-5277
Location: Edwards Aquifer, San Antonio and Barton Springs Segments excluding Travis County
Summary:Note: this document is included for its historical value and may have been replace by more recent updates.
A new numerical ground-water-flow model (Edwards aquifer model) that incorporates important components of the latest information and plausible conceptualization of the Edwards aquifer was developed. The model includes both the San Antonio and Barton Springs segments of the Edwards aquifer in the San Antonio region, Texas, and was calibrated for steady-state (1939“46) and transient (1947“2000) conditions, excluding Travis County. Transient simulations were conducted using monthly recharge and pumpage (withdrawal) data.
The model incorporates conduits simulated as continuously connected (other than being separated in eastern Uvalde and southwestern Medina Counties), one-cell-wide (1,320 feet) zones with very large hydraulic-conductivity values (as much as 300,000 feet per day). The locations of the conduits were based on a number of factors, including major potentiometric- surface troughs in the aquifer, the presence of sinking streams, geochemical information, and geologic structures (for example, faults and grabens).
The simulated directions of flow in the Edwards aquifer model are most strongly influenced by the presence of simulated conduits and barrier faults. The simulated flow in the Edwards aquifer is influenced by the locations of the simulated conduits, which tend to facilitate flow. The simulated sub-regional flow directions generally are toward the nearest conduit and subsequently along the conduits from the recharge zone into the confined zone and toward the major springs. Structures simulated in the Edwards aquifer model influencing groundwater flow that tend to restrict flow are barrier faults. The influence of simulated barrier faults on flow directions is most evident in northern Medina County.
A water budget is an accounting of inflow to, outflow from, and storage change in the aquifer. For the Edwards aquifer model steady-state simulation, recharge (from seepage losses from streams and infiltration of rainfall) accounts for 93.5 percent of the sources of water to the Edwards aquifer, and inflow through the northern and northwestern model boundaries contributes 6.5 percent. The largest discharges are springflow (73.7 percent) and ground-water withdrawals by wells (25.7 percent).
The principal source of water to the Edwards aquifer for the Edwards aquifer model transient simulation was recharge, constituting about 60 percent of the sources of water (excluding change in storage) to the Edwards aquifer during 1956, a drought period, and about 97 percent of the sources (excluding change in storage) during 1975, a period of above-normal rainfall and recharge. The principal discharges from the Edwards aquifer for the transient simulation were springflow and withdrawals by wells. During 1956, representing drought conditions, the change in storage (net water released from storage) was much greater than recharge, accounting for 75.9 percent of the total flow compared to 14.5 percent for recharge.
Conversely, during 1975, representing above-normal rainfall and recharge conditions, recharge constituted 79.9 percent of the total flow, compared to 7.1 percent for the change in storage (net water added to storage).
A series of sensitivity tests was made to ascertain how the model results were affected by variations greater than and less than the calibrated values of input data. Simulated hydraulic heads in the Edwards aquifer model were most sensitive to recharge, withdrawals, hydraulic conductivity of the conduit segments, and specific yield and were comparatively insensitive to spring-orifice conductance, northern boundary inflow, and specific storage. Simulated springflow in the Edwards aquifer model was most sensitive to recharge, withdrawals, hydraulic conductivity of the conduit segments, specific yield, and increases in northern boundary inflow and was comparatively insensitive to spring-orifice conductance and specific storage.
Geophysical Survey to Determine the Depth and Lateral Extent of the Leona Aquifer and Evaluation of Discharge Through the Leona River Floodplain, South of Uvalde, Texas
Description: Determination of groundwater flow regime for the Leona Formation aquifer in the Leona River floodplain
Location: Leona River
Summary:The purpose of this study was to evaluate the depth and lateral extent of the Leona Formation. This data was combined with previously determined Leona Aquifer parameters to estimate the amount of water that may be flowing from the Edwards Aquifer in the area of Leona Springs. This information will improve the overall understanding of the Edwards Aquifer hydrologic budgets. The project report concludes that there may be as much as 100,000 acre feet of water leaving the Edwards Aquifer in the vicinity of Leona Springs.
Accurate assessment and management of the groundwater resources of the Edwards aquifer require that major sources of water recharge into and discharge from the aquifer be adequately determined. Of interest in this investigation is discharge from the Edwards aquifer as surface water or groundwater flow through the Leona River channel which crosses the aquifer. River channel discharge from the aquifer will only occur in places where the Edwards aquifer is unconfined, no significant thicknesses of impermeable materials separate the river channel from the aquifer, and the static level of groundwater
in the Edwards aquifer is higher than the base of the river channel surface or higher than the surface of groundwater flow in the floodplain aquifer.
River channels such as those of the Nueces or Frio Rivers (Figure 1) which cross the Edwards aquifer west and east of the Leona River, respectively, do not have sufficient floodplain sediments for a significant fluvial aquifer. Among these river channels, discharge from the Edwards Aquifer is limited to possible surface (or minimal shallow subsurface) water flowing through the river channel. Water recharge into or discharge from the Edwards Aquifer via rivers such as the Frio and Nueces is determined by calculating gains or losses along a reach of the river using stage and flow measurements.
The Leona River floodplain differs from those of the Frio and Nueces Rivers. The Leona River floodplain consists of relatively thick (i.e., as great as 70-80 ft) sediments that span a width as great as three miles in places. The sediments, part of the Leona Formation, contain significant sand and gravel paleo-streambed deposits that form the Leona aquifer, which can be a locally prolific aquifer. The potential high capacity for groundwater flow may make the Leona River floodplain a significant area of discharge from the Edwards Aquifer. To determine the quantity of groundwater flow through the Leona aquifer, the depth, lateral extent, hydraulic properties, and groundwater gradient must be known or at least reasonably estimated.
A dipole-dipole resistivity survey was conducted in March 2003 to determine the depth and lateral extent of the sand and gravel deposits in the Leona River floodplain. This information was combined with borehole logs, a potentiometric map of groundwater, and the results from a 10-day aquifer test to determine the groundwater flow regime of the Leona Formation aquifer in the Leona River floodplain. The groundwater flow regime was used, in turn, to constrain a conceptual model for groundwater flow through the
Knippa Gap portion of the Edwards Aquifer.
A Statistical Study of the Hydrological Character of the Edwards Aquifer
Description: Statistical analysis of surface and groundwater levels from October 1998 storm event
Location: Edwards Aquifer, Balcones Fault Zone, San Antonio Segment
Summary:The purpose of this study was to evaluate Edwards Aquifer“related hydrologic data from the October 1998 storm event. Surface water and groundwater levels were statistically analyzed to evaluate responses of the aquifer to the major recharge event. The study was completed in November 2001 by Argonne National Laboratory, Argonne, Illinois.
An analysis was performed on data from the October 1998 precipitation in the area of the Edwards Aquifer. Lag times and cross-correlation coefficients were found for the independent variables, including spring flow and water levels in monitor wells. Conclusions derived from the measured data include the following:
- Most of the precipitation from the October 1998 event fell on the eastern portion of the Edwards Aquifer area. This finding is consistent with published information from the USGS.
- Response of river and stream flow to the precipitation event were very rapid and produced sharp peaks in flow with fast recession curves. Because hourly data were not available for the rivers or streams, the storm surge could not be tracked downstream.
- Responses of flows from San Marcos and Comal Springs were rapid, indicating a strong connection with surface water. Peak flows were achieved at San Marcos and Comal Springs in 9 and 11 days, respectively. Because hourly data were not available, the peak could not be further delineated. The more rapid rise to peak flow in San Marcos Springs is indicative of a smaller watershed or a higher transmissivity aquifer.
- Flows in San Marcos and Comal Springs returned to their pre-event values after 166 and 220 days, respectively. The longer recession at Comal Springs may be caused by a larger watershed, a lower transmissivity, or a combination of both.
- The recession curve for flow from San Marcos Springs has a pronounced flat period that starts about 20 days after the rainfall event and lasts about 35 days. The slope of the recession curve is about the same for earlier and later times. This behavior may indicate that there is a substantial storage in the Edwards Aquifer at a depth less than that of peak conditions, or that flow may be arriving from outside its watershed. For the latter case, the travel time is about 20 days.
- Cross-correlation between flows from San Marcos and Comal Springs was very good. Filtering the field data with a moving average window did not significantly improve the results. Similarly, significant improvements were not produced by taking a log transformation of the field data. Maximum cross-correlations were obtained for a zero-day lag time. This finding is consistent with a conceptual model in which there is strong communication with surface water (rivers, streams, and runoff).
- Water levels in monitor wells in the northern portion of the Edwards Aquifer area had very high cross-correlation coefficients, as did water levels in wells in the southern portion of the area. Cross-correlations, however, between water levels in wells in the northern and southern portions of the aquifer were, in general, low.
This finding is consistent with the wells' being completed similarly in the recharge and fresh-water zones, and, as with all statistical correlations, the results may be fortuitous.
- A four-parameter linear regression model demonstrated that inclusion of time series data from the Blanco River was not warranted because of its very high and rapid runoff response to the precipitation event.
- The best overall four-parameter model included flow from Comal Springs and water levels in monitor wells J-17 and Quihi.
- More complex models that include more than four estimated parameters could be constructed, but the inclusion of additional parameters is questionable.
- Results of the model may not be applicable for analysis of other, lower flows because the linear regression model was developed for flood conditions.
Measuring Floodplain Hydraulics of the Frio River Where it Overlies the Edwards Aquifer
Description: Structural and hydrogeological survey of the Frio River to determine if water table underflow contributes to the water budget of the Edwards Aquifer Recharge Zone
Report Number: 20-14152
Location: Frio River, Dry Frio River, Edwards Aquifer Recharge Zone
Summary:The purpose of this study was to reduce uncertainty in recharge calculations involving the Frio and Dry Frio rivers by investigating their hydraulic relationship with the Edwards Aquifer. Geophysical imaging of the subsurface of the floodplains of the Dry Frio River and the Frio River did not detect evidence of significant subsurface flow through either paleo-channel deposits or preferential flow pathways developed in the bedrock. In addition, nearby waterholes and wells contain water from infiltrating rainfall and river flow events or upward leakage of relatively saline water. The source of the water is either the Edwards Aquifer or the Austin Chalk rather than subsurface water flowing in the floodplain. Consequently, surface water gauging of river flows in the Frio and Dry Frio Rivers accurately represents the true volume of recharge of the Edwards and related aquifers by recharge in the river channels. The study was completed in May 2009 by Southwest Research Institute, San Antonio, Texas.
[Excerpted from the report's Conclusions]
[T]he Frio and Dry Frio Rivers are assumed (Hamilton et al., 2008) to be hydraulically connected with the Edwards Aquifer in the Edwards Aquifer recharge zone. Both rivers exit the recharge zone about six miles north of the City of Knippa. There is no evidence of underflow in the Frio and Dry Frio River floodplains. This indicates that surface water flow gauging, if performed immediately before and after the rivers enter and exit the recharge zone, should accurately represent the amount of water recharged to the Edwards Aquifer. Supporting this conceptualization is that the source water for all four waterholes is interpreted to be from depth as springs and that there is no indication of floodplain underflow.


