
 Aquifer Conditions
Science & Data Document Library
Science and Data Resources
Edwards/Glen Rose Hydrologic Communication, San Antonio Region, Texas
Description: Hydrogeological and modeling study of transmissivity between the Glen Rose and Edwards aquifers in the Cibolo Creek Basin and Guadalupe River
Report Number: 95-03
Location: Edwards Aquifer Balcones Fault Zone San Antonio Segment, Glen Rose Aquifer, Cibolo Creek Basin, TX
Summary:This report presents the results from a study conducted to evaluate and estimate the amount of water that might move directly from the Glen Rose aquifer into the Edwards aquifer in the San Antonio region. Three main approaches were used for identifying hydrologic communication and the potential amount of flow between the Glen Rose and the Edwards aquifers: (1) geologic evidence, (2) hydrologic evidence and (3) hydrochemical evidence. The geologic and hydrologic evidence was used both on a site-specific area (Haby Crossing fault area) and regionally to determine quantities of inflow from the Glen Rose.
Hydrologic communication between the Glen Rose and Edwards aquifers in the Cibolo Creek basin has previously been considered different from water transfers between the two aquifers elsewhere. Historically, recharge to the Edwards aquifer in Cibolo Creek basin has been calculated using stream losses from Boerne to Bracken, even though lower Glen Rose is exposed in the creek between Boerne and Bulverde.
Based principally on stream-loss records, available water-level records and the absence of a previously known discharge area, recharge has been assumed to enter the Edwards aquifer as underflow from the Glen Rose Formation in the subsurface through a shallow karst system under Cibolo Creek. However, mapping of the extent of Honey Creek Cave, northeast of Cibolo Creek in this area, and hydrogeologic observations indicate that some water is diverted through cave conduits to the Guadalupe River. As a result, the large stream losses in Cibolo Creek over the lower Glen Rose member previously used to calculate Edwards aquifer recharge may not find its way to the Edwards aquifer unless the water is recharged in the Guadalupe River basin.
The Haby Crossing fault area, because of the relatively large fault displacement, is one of the best locations for the Edwards and Glen Rose Limestones to be juxtaposed to one another, which gives the best potential for hydrologic communication between the two aquifers. Based on calculations from water-level and pumping-test data, it is estimated that about 360 acre-feet per year (ac-ft/yr) of inflow could be transmitted to the Edwards aquifer along a 14-mile length of the Haby Crossing fault under 1994 water-level conditions. This amount is relatively small compared to the average calculated direct recharge in the Medina River basin (about 61,000 ac-ft/yr, as calculated by the U. S. Geological Survey) and the average total aquifer recharge (about 682,800 ac-ft/yr) for the Edwards aquifer in the San Antonio region. Geochemical modeling confirms that only small amounts of Glen Rose water are entering the Edwards aquifer as compared to other recharge sources, possibly on the order of 5 percent of the total water immediately downgradient of the Haby Crossing fault. This initial mix of Edwards and Glen Rose water continues to be diluted as the water travels downgradient toward the main artesian part of the Edwards aquifer near San Antonio. Based on geochemical models using NETPATH and median chemical values, the chemical content of water representative of the Edwards aquifer in the San Antonio region is diluted to less than 1 percent Glen Rose water as compared to the total water content.
Regionally, underflow from the Glen Rose Formation to the Edwards aquifer along the Balcones fault zone can occur by ground water moving laterally in a downgradient direction within the Glen Rose and entering the Edwards aquifer through fault planes. The amount of ground water in transit is dependent on the length of the line of entry (fault plane) through which water enters the Edwards aquifer, the water level gradient across the fault plane from the Glen Rose to the Edwards aquifer, and the effective transmissivity for the Glen Rose aquifer upgradient and along this line.
Using this method, which excludes recharge in Cibolo Creek through the lower Glen Rose to the Edwards and contributions from the Edwards-Trinity Plateau aquifer at the western end of the aquifer, an approximate range of total Glen Rose underflow to the Edwards aquifer would be about 2, 700 to about 11,400 ac-ft/yr in the San Antonio region. These estimates are based on high and low median transmissivities and a positive water-level gradient from the Glen Rose to the Edwards aquifer. As compared to the total Edwards aquifer water budget, these estimates indicate that the Glen Rose contribution is probably less than 2 percent of the total water budget during average recharge conditions.
Medina Lake Hydrology Study
Description: Hydrologic and hydraulic analyses for the Medina Lake and Medina Diversion Lake reservoir system
Report Number: 890014
Location: Medina Lake, Medina Diversion Lake
Summary:This report presents the results of hydrologic and hydraulic analyses for the Medina Lake and Medina Diversion Lake reservoir system. This engineering analysis was conducted in order to determine the availability of surface water from these reservoirs under various operating scenarios for the purpose of recharge to the Edwards Aquifer. Also included in the project objective was an engineering analysis of the hydraulic capacity of each of these facilities under a variety of flood conditions.
The Medina Lake inflows, recharge and seepage curves and historical diversions were used in the reported diversions Scenario 1 with a starting elevation at 1,064.1 feet NGVD. The resulting end-of-month elevations and contents were then compared to the actual historical values for Medina Lake given in Tables 3-2 and 3-3 (TWC, 1980 and US WEST, 1988). A plot of the end-of-month elevations in Figure 3-3 shows that the actual elevation values for the 1940 to 1957 period were lower than the elevations given by the computer simulation for Scenario 1.
This result was investigated further by re-running Scenario 1 with the starting elevation at the historical level in January 1940. The results were similar to those above. However, since the elevations for the historical and simulated cases were very close for the 1957 to 1986 period (when the inflows and canal diversions were based on more reliable, gaged information), it was concluded that the recharge and seepage relationships discussed in Section 3.2 were providing remarkably close results to those observed historically, and could be adopted for use without further evaluation.
The Medina Lake inflows were then verified using a statistical correlation between the Guadalupe River Comfort gage and the Medina River Pipe Creek gage for the 39.5 years of data available at both gages. This analysis predicted a linear relationship between the flows at these gages with an R-squared value of 0.72. Since the average inflows calculated using the statistical equation discussed in this paragraph were larger than the average inflows calculated using the drainage area calculations described above, the original inflows were judged to be the most conservative and appropriate for use in this study. In addition, no justification could be found for lowering the initially computed inflow values.
One of the primary differences between the reservoir operations discussed in this report and the actual historical operation was the criteria used for diversions. Historically, the diversions were made for actual year-to-year irrigation requirements and were not directly dependent on the lake elevation for either the diversion rate or amount. When the scenarios evaluated in this report were operated, the diversion rates were based on the beginning of month elevation. In EH&A's opinion, the historical diversions through the Medina Canal during the 1940-1955 time period were much higher than those reported by BMA. Therefore, this discrepancy in the historical diversions was assumed to be the source of the end-of-month elevation discrepancy found using Scenario 1 (vs. actual historical) and Scenario 1 was discarded and not used for further analyses.
Scenarios 2 through 12 were then performed as described in Section 8.0 in order to evaluate the differences and impacts which can be attributed to the various different operating criteria evaluated in Section 8.0 for recharge purposes.
The conclusions which may be drawn from the results of the yield model are as follows:
1) The optimum reservoir system operation for recharge is to maximize the recharge during wet periods, sustain a constant level of recharge during normal years and to accept no recharge diversions during dry years. This type of operation was illustrated by scenarios 9, 11 and 12 without any correction for leakage.
2) Enhancement of natural recharge by ceasing diversions and maximizing the storage in the reservoir did not, comparatively speaking, prove to be a viable alternative, as demonstrated by Scenario 2. The natural recharge increased by an amount of 8,528 acre-feet per year over the recharge computed by EH&A to have occurred historically.
3) There was no annual demand which could be withdrawn from the reservoir system through the critical drought of record without significant shortages, i.e., there is no firm yield. Even with zero diversions, Medina Lake was drawn down below the outlet levels for 17 consecutive months during the 1949 to 1957 drought, due to evaporation, natural recharge and leakage. This is demonstrated by Scenario 3.
4) Leakage correction at the Diversion Dam will net an additional 4,500 acre-feet per year when the recommended minimum flows are provided downstream.
5) Leakage correction at the Main Dam will not increase the amount of water available for recharge. The Main Dam leakage rate at full level is approximately equal to the Diversion Lake recharge rate, diversions and minimum flows.
6) The flows to the San Antonio Bay were not significantly affected by the different scenarios tested. The maximum difference in bay inflows was observed between Scenario 2, No Diversions, and Scenario 10, Artificial Recharge/Minimum Flows/Leakage Correction. Scenario 2 had a bay inflow of 1,552, 271 ac-ft per year while Scenario 10 had a bay inflow of 1,517,214 ac-ft per year. The difference of 35,057 ac-ft per year represents only 2.26% of the Scenario 2 inflows.
7) The hydroelectric system generation capability as assumed by Prodek in their analyses may be affected by altering the system operating criteria to a recharge operation specifically, due to significant differences in methodologies employed by Prodek in their studies and those developed in this study, Prodek's analysis may give higher flows being available for hydroelectric power generation than this study would support even with no alteration in the system operating criteria. Also, the impact will vary greatly, depending upon which scenarios of operation are compared.
8) The natural recharge and leakage curves for Medina Lake and Diversion Lake given in Figures 3-1 and 3-2, respectively, should be adopted by the Edwards Underground Water District for future calculations of natural recharge from the lakes. Further studies should be performed including additional stream gaging as described in Appendix B.
Tracing Groundwater Flowpaths in the Vicinity of San Marcos Springs, Texas

Description: Tracer studies of the San Marcos Springs springshed from 2002 -2010
Report Number: 1-Dec
Location: Edwards Aquifer, Balcones Fault Zone, San Antonio Segment, San Marcos Springs springshed, Hays County, Balcones Springs Segment, Travis County
Summary:This report presents the findings of investigations by the Edwards Aquifer Authority (EAA) along with other agencies regarding groundwater flowpaths in the San Marcos Springs springshed. The purpose of this study was to characterize the nature of groundwater flow to San Marcos Springs in the Edwards Aquifer recharge zone in Hays County in south-central Texas. Part of the investigation was focused on defining the groundwater boundary between San Marcos Springs in the southern segment of the Edwards Aquifer and Barton Springs in the Barton Springs segment of the Edwards Aquifer. The scope of this investigation consisted of 31 tracer tests (dye injections) completed between 2002 and 2010 at various locations in the vicinity of San Marcos Springs. Results of the tracer tests revealed discrete groundwater flowpaths and groundwater velocities up to several thousand feet per day connecting the recharge zone to San Marcos Springs and Barton Springs, which is consistent with the karstic nature of the Edwards Aquifer. The results indicated that San Marcos Springs and Barton Springs are important discharge points for the regional Edwards Aquifer flow system. Based on the fastest groundwater velocities, San Marcos Springs receives most of its recharge from the southwest along the San Marcos Springs Fault and smaller amounts from west and north of the springs. The boundary between San Marcos Springs and Barton Springs springsheds lies near the confluence of the Blanco River and Halifax Creek under drought conditions when Onion Creek is dry. The divide moves north along Onion Creek in the recharge zone during wetter conditions when Onion creek is flowing and recharging groundwater. Consequently, the Blanco River can recharge both spring complexes depending on hydrologic conditions.
Tracing Groundwater Flowpaths in the Edwards Aquifer Recharge Zone, Panther Springs Creek Basin, Northern Bexar County, TX
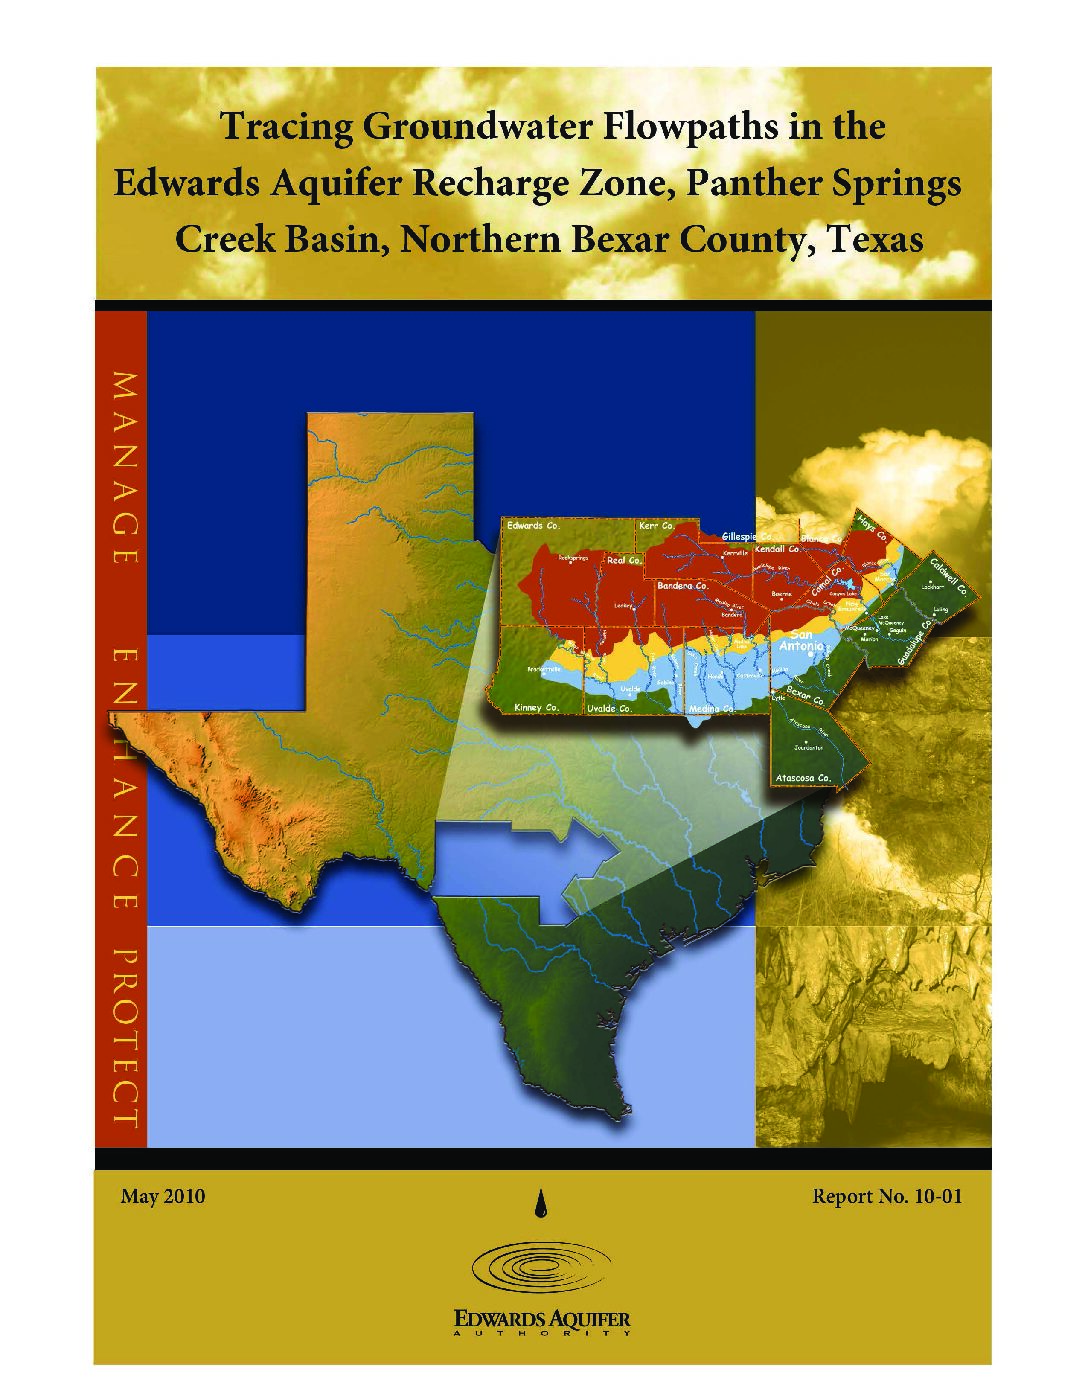
Description: Dye tracer tests in the Edwards Aquifer, Balcones Fault Zone, San Antonio Segment, Bexar County, Panther Springs Creek
Report Number: 1-Oct
Location: Edwards Aquifer, Balcones Fault Zone, San Antonio Segment, Bexar County, Recharge Zone, Artesian Zone,
Summary:The purpose of this study was to characterize groundwater-flow directions and velocities and to evaluate hydrostratigraphy in the Edwards Aquifer recharge zone in northern Bexar County in south-central Texas. It presents the findings of investigations by the Edwards Aquifer Authority regarding groundwater flowpaths, velocities, and hydrostratigraphy in the Panther Springs Creek groundwater basin, which is located in the San Antonio segment of the Balcones Fault Zone Edwards Aquifer. In a series of four phases, the Authority injected nontoxic organic dyes into six caves and sampled an array of 32 wells to track the dye movements. The tracer tests revealed discrete groundwater flowpaths near Panther Springs Creek with apparent (point-to-point) groundwater velocities ranging from 13 to 5,300 meters per day from the recharge zone to the transition/artesian zone of the Edwards Aquifer. The results indicated that groundwater flows freely across faults with displacements up to 104 meters through a single hydrostratigraphic unit comprised of the upper member of the Glen Rose Formation in the Upper Trinity Aquifer and the overlying Edwards Aquifer. Dye poured on the ground surface in an area with no observable karst features such as sinkholes, dissolutioned fractures, or caves demonstrated that the aquifer is vulnerable to contamination even in the absence of recognizable karst landforms.
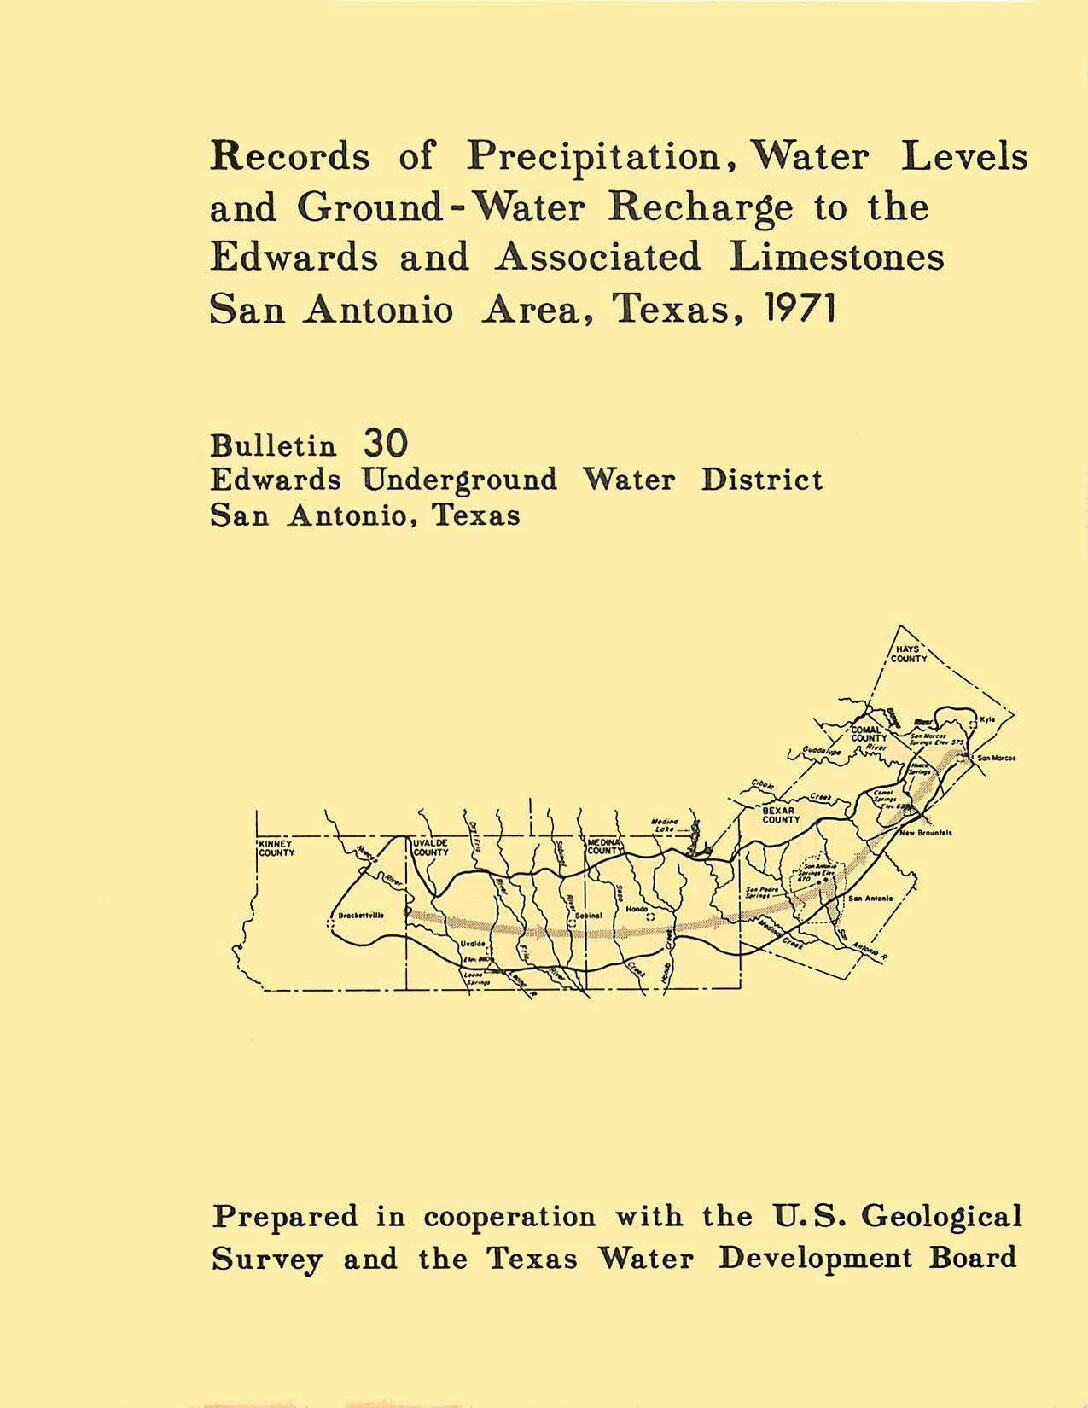
Records of Precipitation, Aquifer Head, and Ground-Water Recharge to the Edwards and Associated Limestones, San Antonio Area, Texas, 1971
Description: Annual report for 1971 on precipitation, aquifer levels, and recharge to the Edwards Aquifer issued by the Edwards Underground Water District
Report Number: Bulletin 30
Location: Edwards Aquifer - San Antonio Area
Summary:Records of precipitation, water levels, and estimates of recharge to the Edwards and associated limestones in the San Antonio area during 1971 are summarized in this report. The compilation of these basic records is part of a continuing hydrologic investigation by the U.S. Geological Survey in cooperation with the Edwards Underground Water District and the Texas Water Development Board. Previous reports are given in the list of references.
The annual precipitation at selected stations throughout the San Antonio area for 1971 and the annual average for each of these stations are shown in table 1. Rainfall was above average throughout most of the recharge area during 1971.
The recorded high and low water levels in five selected key wells during 1971 are shown in table 2. During the year, the water levels reached a lower point during June than had been experienced for several years; however, toward the latter part of the year, the water levels fluctuated near the record highs. The record highs and lows are also given in table 2. Ground-water storage in the Edwards Limestone remained above average during 1971.
Recharge to the Edwards and associated limestones is chiefly from streams that lose most of their base flow and a part of their flood flow as they cross the Balcones Fault Zone on the outcrop of the aquifer. The recharge is estimated from discharge records at gaging stations located above and below the infiltration areas on most of the streams. The monthly mean discharge at the gaging stations for October-December 1971 is given in table 3. Streamflow records for January-September 1971 will be published by the U. S. Geological Survey in late 1972.
The recharge in each basin of the San Antonio area for 1971 and the average annual recharge for the period 1934-70 are given in table 4. The basic methods employed by Petitt and George (1956) and by Garza (1962) were used for estimating the 1971 recharge. Total recharge in 1971 was in excess of the average annual recharge by nearly 400,000 acre-feet and was about 75 percent above the annual average {see table 4).
Floods resulting from high-intensity rains during August through November provided about 75 percent of the annual recharge, while the remaining recharge was provided by springflow from the Edwards Plateau.
Quality of Stormwater Runoff from an Urbanizing Watershed and a Rangeland Watershed in the Edwards Aquifer Recharge Zone, Bexar and Uvalde Counties, Texas, 1996-98
Description: Water quality study on stormwater runoff in an urbanizing vs rural area of the Edwards Aquifer Recharge Zone
Report Number: USGS O-FR 99-245
Location: Edwards Aquifer Recharge Zone, Bexar County, Uvalde County
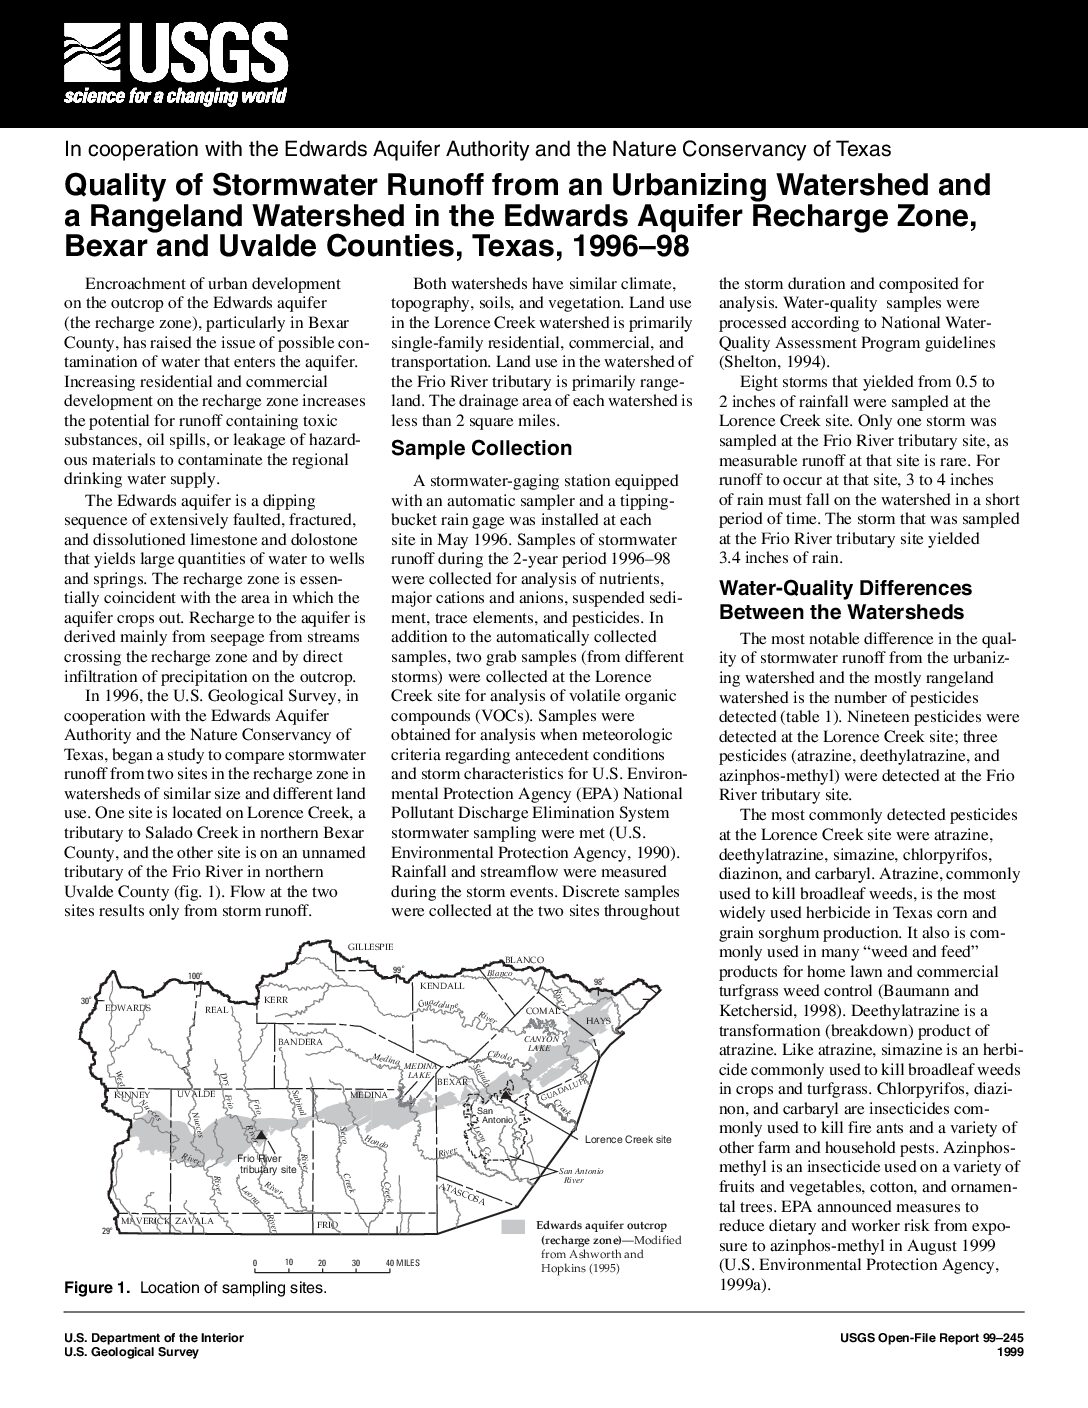
Summary:In 1996, the U.S. Geological Survey, in cooperation with the Edwards Aquifer Authority and the Nature Conservancy of Texas, began a study to compare stormwater runoff from two sites in the recharge zone in watersheds of similar size and different land use. One site is located on Lorence Creek, a tributary to Salado Creek in northern Bexar County, and the other site is on an unnamed tributary of the Frio River in northern Uvalde County (fig. 1). Flow at the two sites results only from storm runoff. Both watersheds have similar climate, topography, soils, and vegetation. Land use in the Lorence Creek watershed is primarily single-family residential, commercial, and transportation. Land use in the watershed of the Frio River tributary is primarily rangeland. The drainage area of each watershed is less than 2 square miles.
The most notable difference in the quality of stormwater runoff from the urbanizing watershed and the mostly rangeland watershed is the number of pesticides detected (table 1). Nineteen pesticides were detected at the Lorence Creek site; three pesticides (atrazine, deethylatrazine, and azinphos-methyl) were detected at the Frio River tributary site.Six VOCs were detected in the two grab samples collected at the Lorence Creek site. Four of the six VOCs detected (1,2,4-trimethylbenzene, benzene, ethylbenzene, and xylenes) are used as gasoline additives (Lucius and others, 1992). Concentrations of all pesticides and VOCs detected for which EPA has established maximum allowable or recommended concentrations for drinking water were less than those maximums (U.S. Environmental Protection Agency, 1999b).
Evapotranspiration A Method of Disposing of Septic Tank Effluent
Description: Feasibility study for evapotranspiration as an effective means of disposing septic tank effluent
Report Number: G 75-185
Location: Edwards Aquifer Recharge Zone, Bexar County
Summary:The Edwards Aquifer, an extensive formation of limestone and dolomite extending over a vast portion of central Texas, is the sole source of water for over 1,000,000 people. Its Recharge Zone, encompassing all or parts of some nine counties, is particularly vulnerable to contamination if population growth and property development continues to the north of the metropolitan areas which are on or adjacent to the zone.
While the septic tank-soil absorption system is a valuable and popular method of disposing of domestic household sewage, this and other traditional methods of sewage disposal are not suitable in this instance because of the geology of the Recharge Zone and very thin soil cover.
After an extensive search of the literature, RABA AND ASSOCIATES, CONSULTING ENGINEERS, INC., petitioned the Edwards Underground Water District for its support and funding to develop design criteria for the construction and installation of a viable alternative to the traditional methods of septic tank effluent disposal. This alternative was the evapotranspiration process.
Beginning in July, 1975, and extending over a period of two years, a multi-discipline team of researchers investigated and obtained design parameters at an experimental site located in north Bexar County, Texas, an area which is a part of the Recharge Zone. While it was known that investigations had been made of evapotranspiration by others, the majority of this prior research was directed toward studying water loss via this process but with an eye to conserving water. This project was designed to study the opposite view. Here, by encouraging water loss from a set of test tanks, insight was gained into means of utilizing this loss to remove fluid wastes deposited in the system from a septic tank.
The principle. conclusion drawn from this study is that evapotranspiration is a viable alternative to traditional methods of sewage disposal in areas of very low permeability or areas with extremely high permeability in which underground aquifers may be endangered. The design criteria sought have been established although more study is needed to refine and improve certain aspects of the procedure. As a result of the present work, it is now possible to determine with reasonable accuracy the surface area needed to permit the installation and proper functioning of an evapotranspiration system.
Edwards Aquifer Authority Well Plugging and Abandonment Study

Description: Geophysical tests on an abandoned well to determine best method of achieving sealing of the annular space
Report Number: 1-Dec
Location: Bexar County
Summary:EAA regulations require plugging of abandoned wells, including either removal of existing casing or perforation of the well casing and subsequent sealing of the annular space. Prior to implementation of EAA regulations, wells were commonly abandoned by filling of the well bore and casing with cement or grout and ignoring the annular space. Poor sealing of the annular space of wells, either during drilling or plugging, has the potential to contribute to groundwater contamination.
This study was developed to evaluate the effectiveness of current well-plugging methodology required in the EAA's rules when applied to Edwards Aquifer wells. The study involved:
*Applying a suite of geophysical logging tools to an Edwards Aquifer well before plugging to identify depths at which little or no annular seal was present.
*Subsequent perforation of well casing at selected depths with perforation intervals on the basis of results of geophysical logging.
*Sealing of well bore and annular space, redrilling of well bore, relogging of well to ascertain quality of cement seal, and final abandonment of the well.
Geophysical tools, including a three-arm caliper, natural gamma, DHC, FWS, and nuclear (compensated gamma“gamma density and neutron) tools, were used to evaluate the effectiveness of current well-plugging practices for the protection of water quality. The caliper, the DHC, and the natural gamma tools provided an assessment of the inside condition of the casing, but they were unable to evaluate the condition of the annular space between the outside of the casing and geologic formations. The FWS tool may provide some insight into the annular seal of a well; however, it does not appear to have the resolution or reliability of the nuclear tools.
The compensated gamma“gamma density and neutron source tools provided a means of evaluating the condition of the annular seal, as well as a delineation of voids in the annular space. Additionally, the CDL seemed to be more useful in void detection in the annular space, requiring both compensated gamma“gamma density and neutron source tools to get the job done. These tools can be used within or above the water table without impact to log quality or diagnostic capabilities.
W104-265 (Car Lot Well) was selected for this study because it offered a larger diameter casing (six inches) and a longer casing than other wells that have been examined. Perforation points were chosen on the basis of distinctive qualities of the annular seal, as determined from nuclear logs. Two of the perforation locations were selected at intervals in which the annular seal was evaluated as good, and three perforation locations were selected at intervals in which the annular seal was evaluated as poor to nonexistent. The intervals 42 to 88 and 125 to 185 ft are locations at which a good annular seal was suggested. Intervals from 28 to 42, 192 to 222, and 232 to 289 ft were evaluated and estimated to contain 50 to 100% void space. So that the effect of perforations on casing with good annular seal versus casing with 50% or greater void space in the annulus could be compared, perforations were made in both areas. Perforation depths of 53 and 135 ft bgs were selected for good annular seal tests, whereas perforations at 30, 193, and 271 ft bgs were selected to test areas with 50% or greater annular void space. Clean, round holes were formed by shaped explosive charges where solid annular material occurred between the casing and the borehole wall. Casing cracked or split in intervals where little or no material occurred in the annular space. Analysis of nuclear logs indicates that plugging of the annular void area through the perforations was highly successful. Postperforation and cementing source logging indicated that a good seal was achieved in areas previously indicating 50% or greater void space, and no significant change was noted for the two areas that indicated a good annular seal.
This study showed that grouting of the well using gravity-fed tremmie methods from the bottom to the top provided pressure sufficient to force cement through the perforations in the well casing, creating an adequate annular seal. Decreasing the explosive-charge interval from 50 to 25 ft would increase the likelihood of intersecting an annular void.
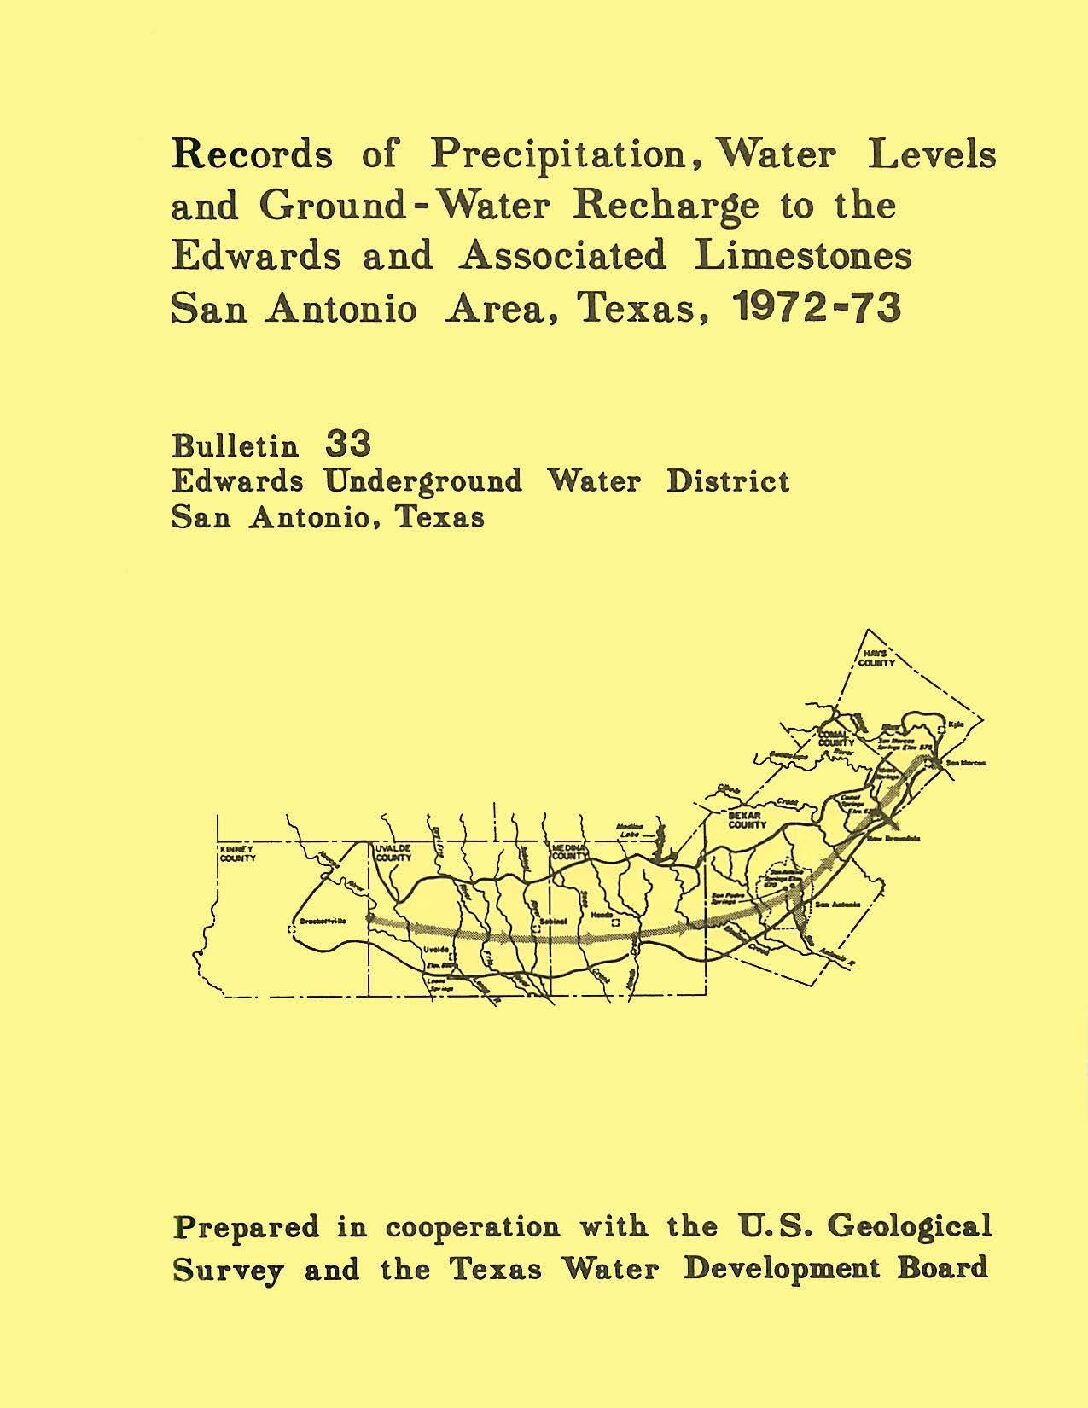
Records of Precipitation, Aquifer Head, and Ground-Water Recharge to the Edwards and Associated Limestones, San Antonio Area, Texas, 1972-73
Description: Annual report for 1972-73 on precipitation, aquifer levels, and recharge to the Edwards Aquifer issued by the Edwards Underground Water District
Report Number: Bulletin 33
Location: Edwards Aquifer Balcones Fault Zone San Antonio Segment
Summary:Records of precipitation, water levels, and estimates of recharge to the Edwards and associated limestones in the San Antonio area during 1972-73 are summarized in this report.
Rainfall for 1972 was near average at most of the stations in the San Antonio area. During 1973, a new annual rainfall record of 52.28 inches was recorded at the San Antonio station, and rainfall was well above average at selected stations throughout the area.
Ground-water storage in the Edwards and associated limestones was well above average during 1972-73.
Recharge in 1972 and 1973 was in excess of the average annual recharge. During 1973, the recharge was in excess of the average annual recharge by nearly 955,000 acre-feet, or about 180 percent of the annual average.
Quantity and Quality of Low Flow in the Hondo Creek Basin, Texas March 27-28, 1968
Description: Low-flow study of Hondo Creek Basin, TX March 27-28, 1968
Location: Hondo Creek Basin
Summary:This investigation was made to determine the changes in quantity and quality of low flow in the reach of Hondo Creek that contributes recharge to the Edwards and associated limestones.
A determination of the gains and losses in a 29.5-mile reach of Hondo Creek near Hondo, Texas, was made on March 27-28, 1968. A net loss of 106 cfs (cubic feet per second) occurred in the reach (site 2 to site 8) that contributes recharge to the Edwards and associated limestones. These losses were greater than those that occurred during the previous low-flow investigation in April 1958. The quality of water showed a general improvement downstream except for sites on and downstream from Verde Creek.
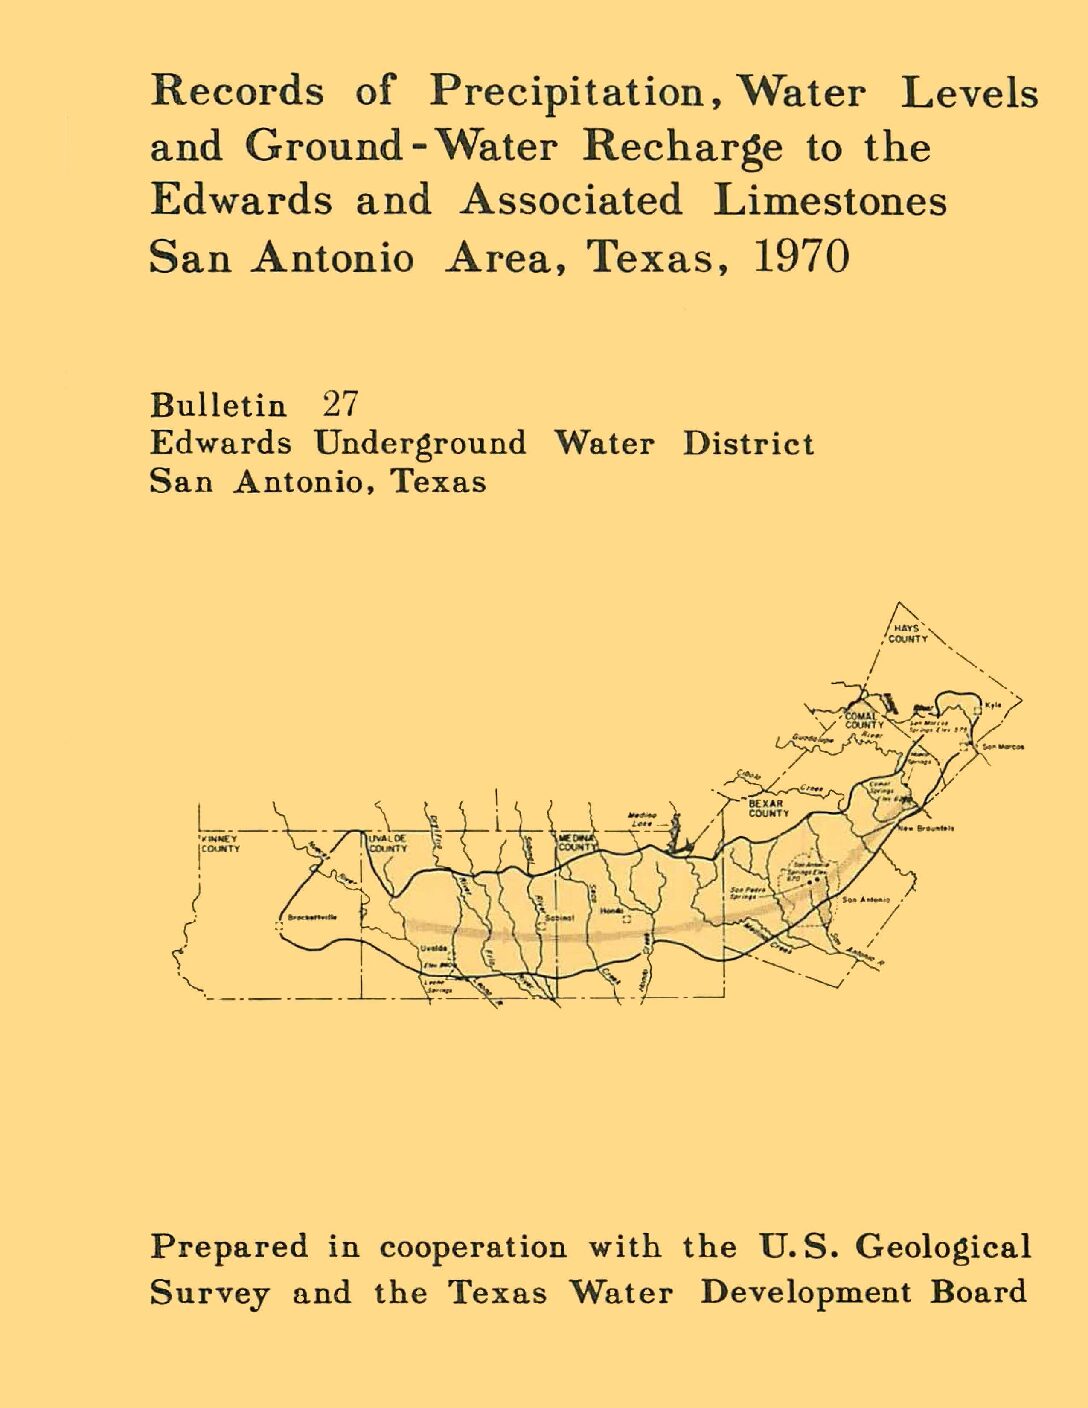
Records of Precipitation, Aquifer Head, and Ground-Water Recharge to the Edwards and Associated Limestones, San Antonio Area, Texas, 1970
Description: Annual report for 1970 on precipitation, aquifer levels, and recharge to the Edwards Aquifer issued by the Edwards Underground Water District
Report Number: Bulletin 27
Location: Edwards Aquifer Balcones Fault Zone San Antonio Segment
Summary:Records of precipitation, water levels, and estimates of recharge to the Edwards and associated limestones in the San Antonio area during 1970 are summarized in this report.
Rainfall for 1970 was below average throughout most of the recharge area. The water levels fluctuated just below the record high, owing to recharge from high flood runoff during intense storms. Groundwater storage in the Edwards Limestone remained above average during 1970. The estimated recharge was 661,600 acre-feet, which is about 30 percent above the average recharge for the period 1934-69.
Records of Precipitation, Aquifer Head, and Ground-Water Recharge to the Edwards and Associated Limestones, San Antonio Area, Texas, 1969
Description: Annual report for 1969 on precipitation, aquifer levels, and recharge to the Edwards Aquifer issued by the Edwards Underground Water District
Report Number: Bulletin 24
Location: Edwards Aquifer Balcones Fault Zone San Antonio Segment
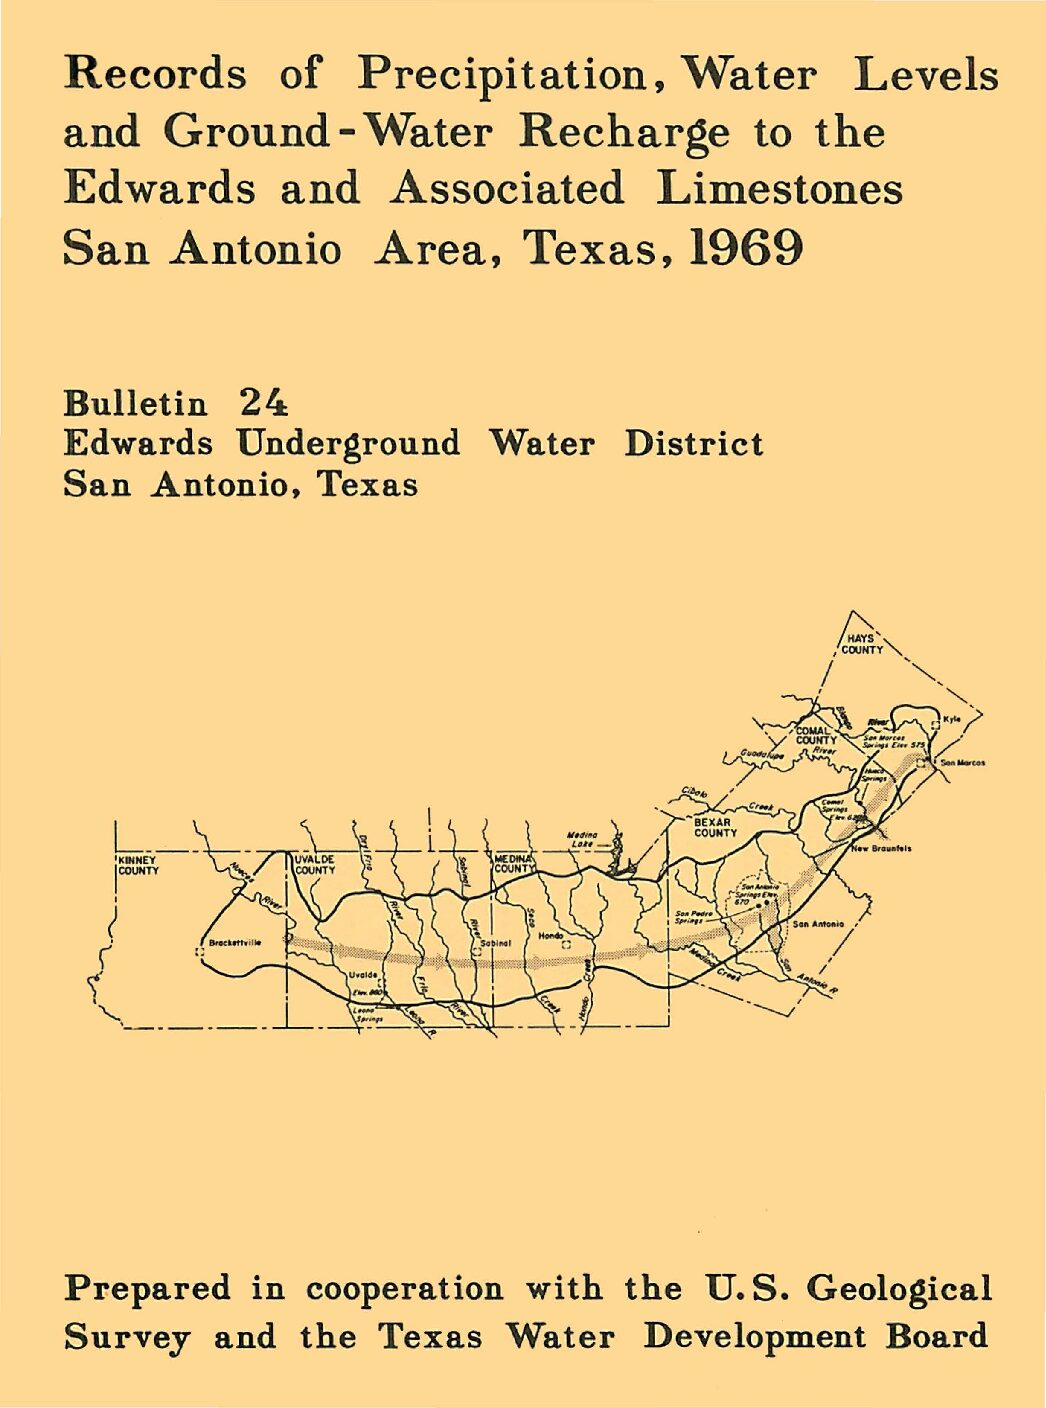
Summary:Records of precipitation, water levels, and estimates of recharge to the Edwards and associated limestones in the San Antonio area during 1969 are summarized in this report. The compilation of these basic records is part of a continuing hydrologic investigation by the U. S. Geological Survey in cooperation with the Edwards Underground Water District and the Texas Water Development Board. Previous reports are given in the list of references.
The annual precipitation at selected stations throughout the San Antonio area for 1969 and the annual average for each of these stations are shown in table 1. Rainfall was above average throughout the recharge area during 1969.
The recorded high and low water levels in five selected key wells during 1969 are shown in table 2. During the year, the water levels fluctuated just below the record high. The record highs and lows are also given in table 2. Ground-water storage in the Edwards limestone was above average during 1969.
Recharge to the Edwards and associated limestones is chiefly from streams that lose most of their base blow and a part of their flood flow as they cross the Balcones Fault Zone on the outcrop of the aquifer. The recharge is estimated from discharge records at gaging stations located above and below the infiltration areas on most of the streams. The monthly mean discharge at the gaging stations for October-December 1969 is given in table 3. Streamflow records for JanuarySeptember 1969 will be published by the U.S. Geological Survey in late 1970.
The recharge in each basin of the San Antonio area for 1969 and the average annual recharge for the period 1934-68 are given in table 4. The basic methods employed by Petitt and George (1956) and by Garza (1962) were used for estimating the 1969 recharge.
Springflow from the Edwards Plateau was the main source of recharge during the first nine months of 1969, while floods during the last three months furnished the main source of recharge. The total recharge was about 10 percent above the average annual (see table 4).
Records of Precipitation, Aquifer Head, and Ground-Water Recharge to the Edwards and Associated Limestones, San Antonio Area, Texas, 1968
Description: Annual report for 1968 on precipitation, aquifer levels, and recharge to the Edwards Aquifer issued by the Edwards Underground Water District
Report Number: Bulletin 21
Location: Edwards Aquifer Balcones Fault Zone San Antonio Segment
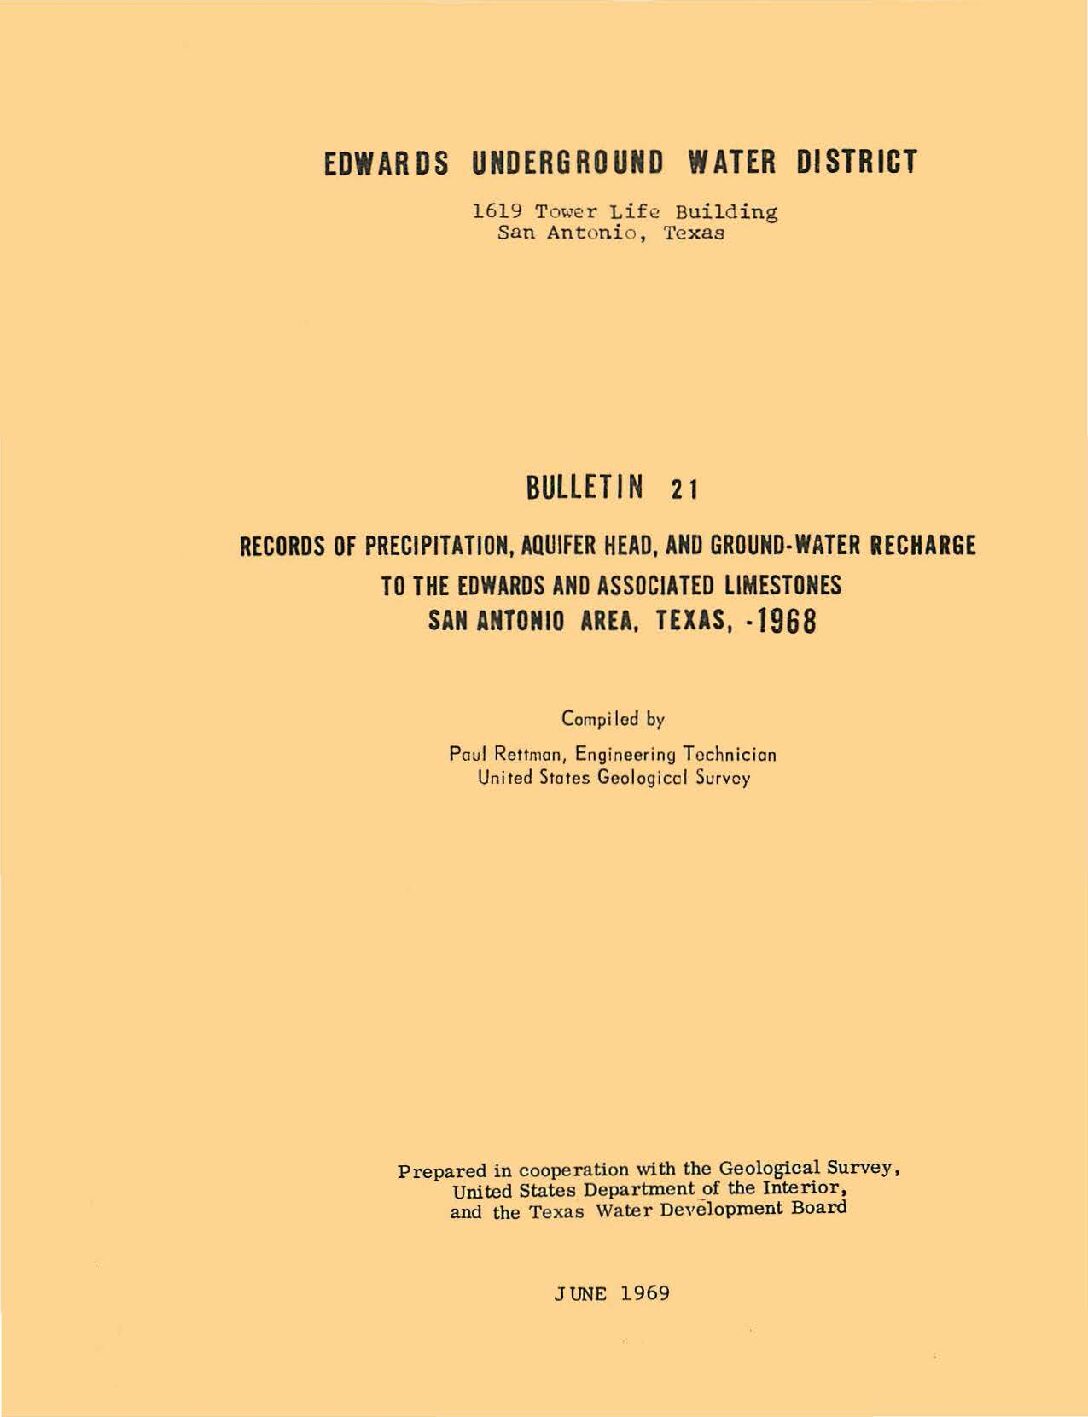
Summary:The Edwards and associated limestones, the principal aquifer in the San Antonio area, has been the subject of numerous geologic and hydrologic reports. Records of precipitation, water levels, and estimates of recharge to the aquifer during 1967 are summarized in this report, which is part of the basic-data collection published by the Edwards Underground Water District. The compilation of these basic records (and data} is part of the continuing hydrologic investigation by the Uo S. Geological Survey in cooperation with the Edwards Underground Water District and the Texas Water Development Board.
The annual precipitation at selected stations throughout the San Antonio area for 1967 and the annual average for each of these stations are shown in table 1. Rainfall was generally deficient for the first eight months of 1967 and excessive during the remainder of the year.
The recorded high and low water levels in five selected key wells during 1967 are shown in table 2. During the year, the water levels fluctuated near the midpoint between the record high and low levels which are also shown in table 2. Ground water storage and water levels in the Edwards limestone reached a lower point during August than had been experienced for several years.
Recharge to the Edwards and associated limestones is chiefly from streams which lose most of their base flow and a part of their floodflow as they cross the Balcones fault zone on the outcrop of the aquifer. The recharge is estimated from discharge records at gaging stations located above and below the infiltration areas on most of the streams. The monthly mean discharge at the gaging stations for October-December 1967 are shown in table 3. Streamflow records for January-September 1967 are being published by the U. S. Geological Survey (U. s. Department of the Interior, 1967).
The recharge in each basin of the San Antonio area for 1967 and the average annual recharge for the period 1934-66 are shown in table 4. The basic methods employed by Petitt and George (1956) and by Garza (1962) were used for estimating the 1967 recharge, which was below the average annual. In September 1967, the deficient rainfall pattern was broken by the rains that accompanied Hurricane Beulah. Seventy-five percent of the total recharge for 1967 occurred during the last four months of the year.
Evaluation of the Option to Designate a Separate San Marcos Pool for Critical Period Management

Description: Hydrogeologic relationships between nearby streams and rivers to springflow at San Marcos Springs
Report Number: 1-Aug
Location: San Marcos Springs
Summary:This report presents the findings of the Edwards Aquifer Authority's investigation into the hydrogeology and hydrodynamics of water discharging from San Marcos Springs in Hays County, Texas. The purpose of the report is to determine whether there is sufficient technical justification for distinct aquifer management rules for the designation of a San Marcos Pool in the San Marcos area regarding critical period management. Historical records indicate that Comal Springs and San Marcos Springs respond differently to rainfall, which could indicate that these springs represent separate hydrologic subbasins or pools within the San Antonio Segment of the Balcones Fault Zone Edwards Aquifer. The report concludes that water for both San Marcos Springs and Comal Springs is derived from the western portion of the aquifer. Groundwater flows through the Artesian fault block and either discharges from Comal Springs or bypasses Comal Springs and discharges at San Marcos Springs. At higher discharge rates, San Marcos Springs is also recharged by water infiltrating from Cibolo Creek, the Guadalupe River, Dry Comal Creek, Sink Creek, and other streams, especially when a groundwater mound forms under Onion Creek. Despite the large volume of water that these streams carry at times, they contribute relatively small amounts to San Marcos springflow. The report concludes that there is not sufficient technical justification at this time to create a separate San Marcos Pool and recommends that an index well be established in the San Marcos area for triggering critical period levels. The report was prepared by Authority staff in February 2008.
Records of Precipitation, Aquifer Head, and Ground-Water Recharge to the Edwards and Associated Limestones, San Antonio Area, Texas, 1967
Description: Annual report for 1967 on precipitation, aquifer levels, and recharge to the Edwards Aquifer issued by the Edwards Underground Water District
Report Number: Bulletin 18
Location: Edwards Aquifer Balcones Fault Zone San Antonio Segment
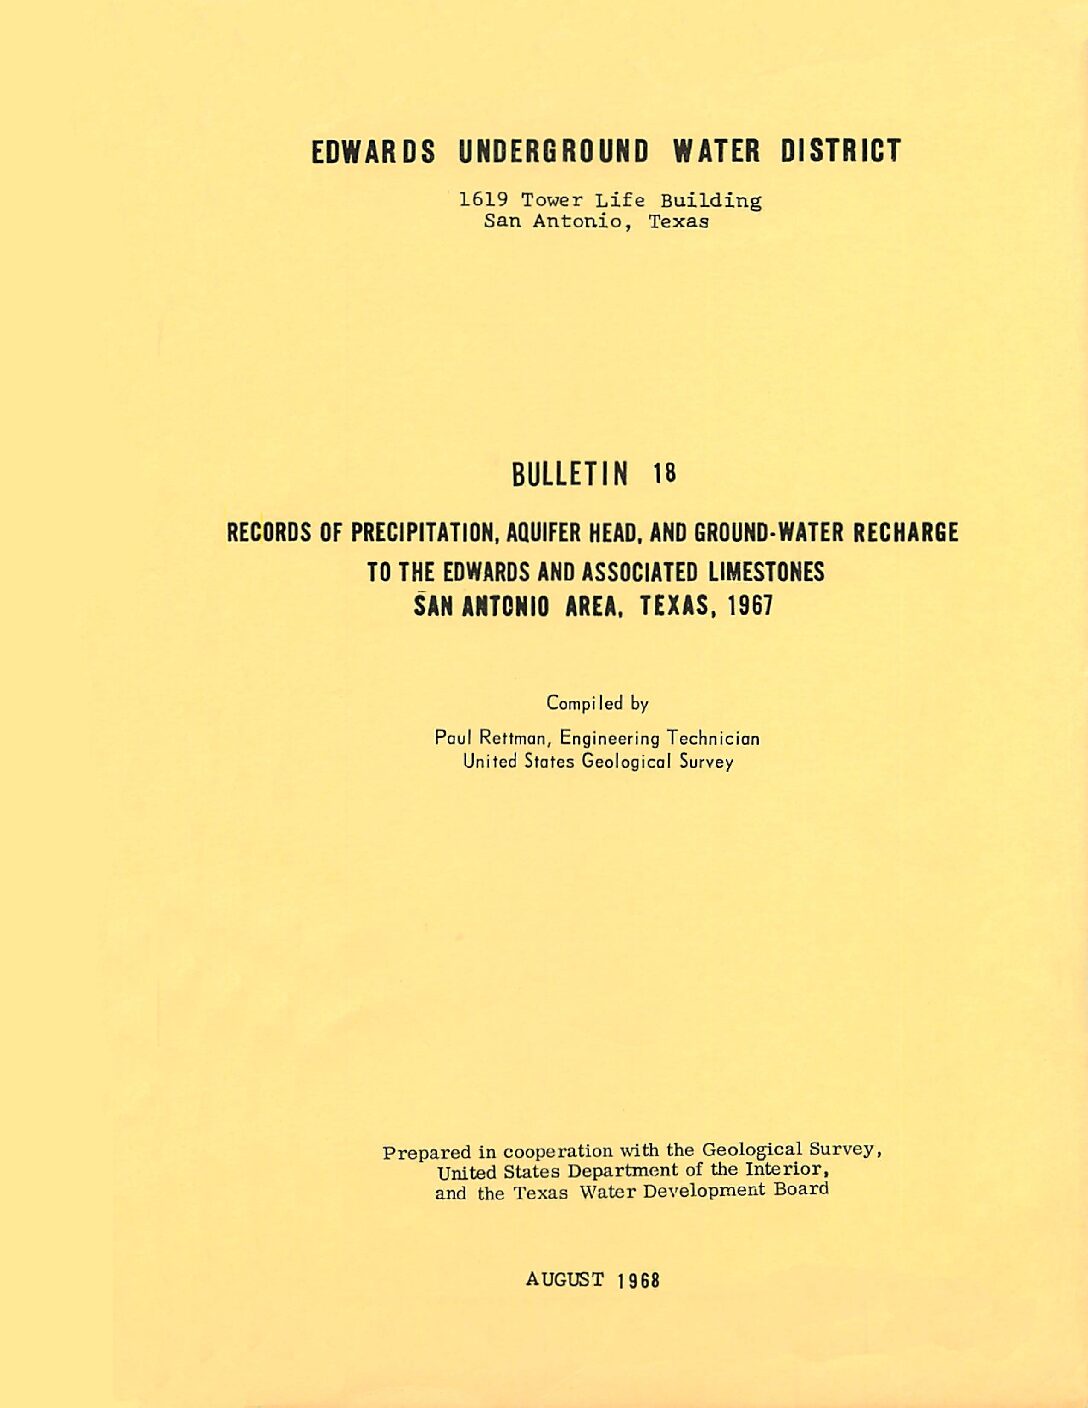
Summary:The Edwards and associated limestones, the principal aquifer in the San Antonio area, has been the subject of numerous geologic and hydrologic reports. Records of precipitation, water levels, and estimates of recharge to the aquifer during 1967 are summarized in this report, which is part of the basic-data collection published by the Edwards Underground Water District. The compilation of these basic records (and data} is part of the continuing hydrologic investigation by the Uo S. Geological Survey in cooperation with the Edwards Underground Water District and the Texas Water Development Board.
The annual precipitation at selected stations throughout the San Antonio area for 1967 and the annual average for each of these stations are shown in table 1. Rainfall was generally deficient for the first eight months of 1967 and excessive during the remainder of the year.
The recorded high and low water levels in five selected key wells during 1967 are shown in table 2. During the year, the water levels fluctuated near the midpoint between the record high and low levels which are also shown in table 2. Ground water storage and water levels in the Edwards limestone reached a lower point during August than had been experienced for several years.
Recharge to the Edwards and associated limestones is chiefly from streams which lose most of their base flow and a part of their floodflow as they cross the Balcones fault zone on the outcrop of the aquifer. The recharge is estimated from discharge records at gaging stations located above and below the infiltration areas on most of the streams. The monthly mean discharge at the gaging stations for October-December 1967 are shown in table 3. Streamflow records for January-September 1967 are being published by the U. S. Geological Survey (U. s. Department of the Interior, 1967).
The recharge in each basin of the San Antonio area for 1967 and the average annual recharge for the period 1934-66 are shown in table 4. The basic methods employed by Petitt and George (1956) and by Garza (1962) were used for estimating the 1967 recharge, which was below the average annual. In September 1967, the deficient rainfall pattern was broken by the rains that accompanied Hurricane Beulah. Seventy-five percent of the total recharge for 1967 occurred during the last four months of the year.


