
 Aquifer Conditions
Science & Data Document Library
Science and Data Resources
Records of Precipitation, Aquifer Head, and Ground-Water Recharge to the Edwards and Associated Limestones, San Antonio Area, Texas, 1970
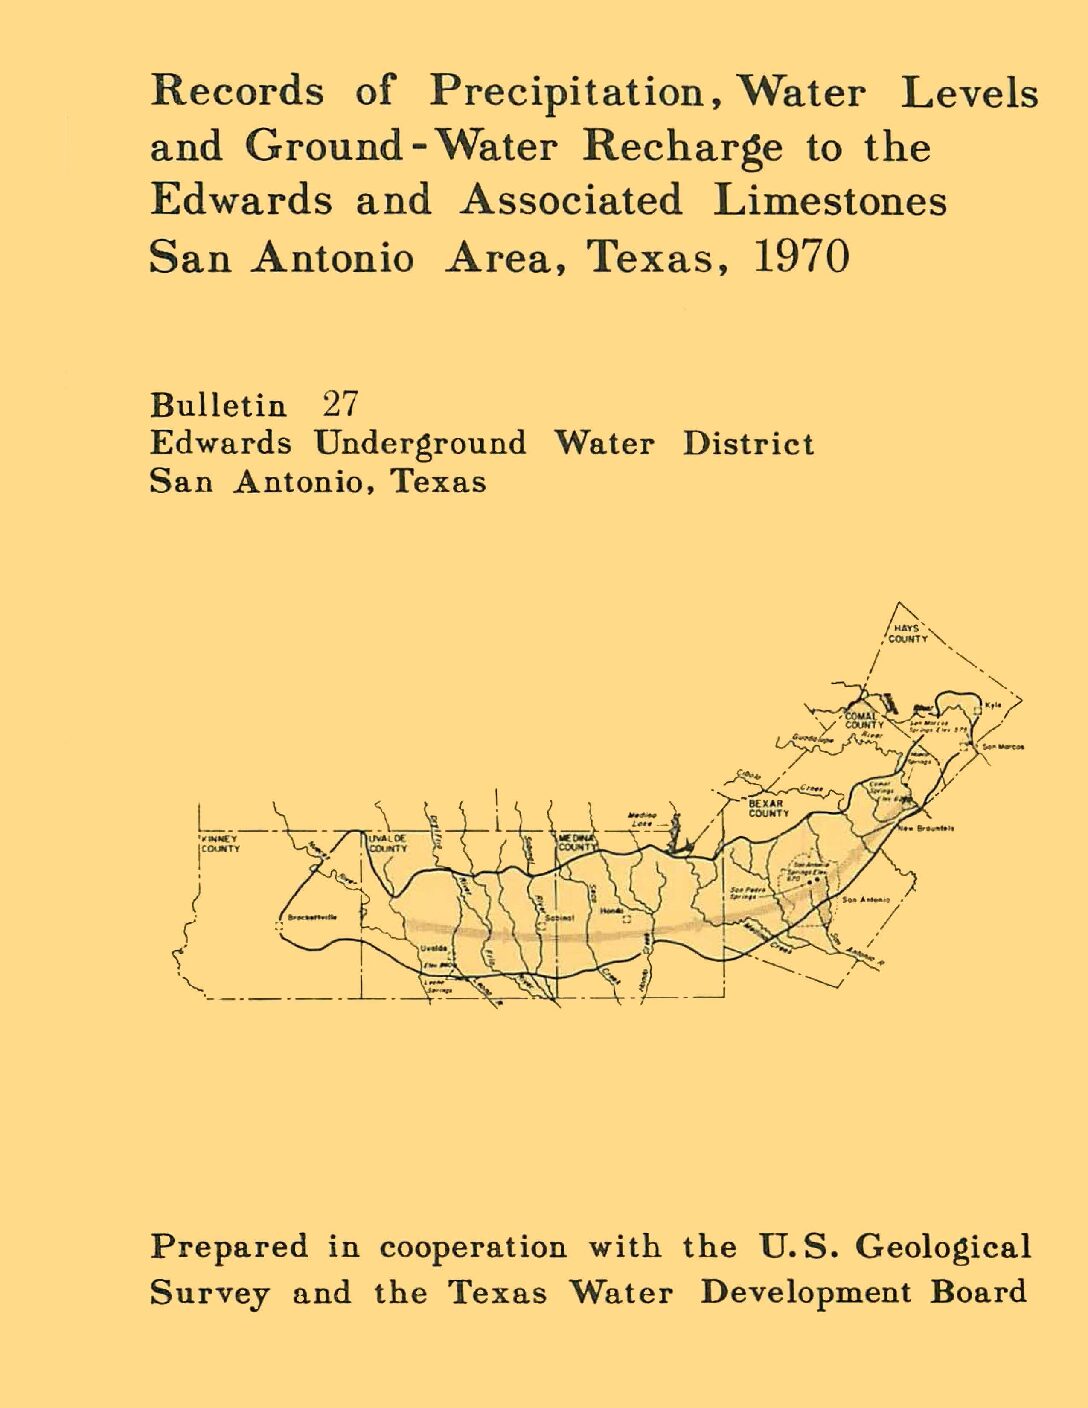
Description: Annual report for 1970 on precipitation, aquifer levels, and recharge to the Edwards Aquifer issued by the Edwards Underground Water District
Report Number: Bulletin 27
Location: Edwards Aquifer Balcones Fault Zone San Antonio Segment
Summary:Records of precipitation, water levels, and estimates of recharge to the Edwards and associated limestones in the San Antonio area during 1970 are summarized in this report.
Rainfall for 1970 was below average throughout most of the recharge area. The water levels fluctuated just below the record high, owing to recharge from high flood runoff during intense storms. Groundwater storage in the Edwards Limestone remained above average during 1970. The estimated recharge was 661,600 acre-feet, which is about 30 percent above the average recharge for the period 1934-69.
Records of Precipitation, Aquifer Head, and Ground-Water Recharge to the Edwards and Associated Limestones, San Antonio Area, Texas, 1969
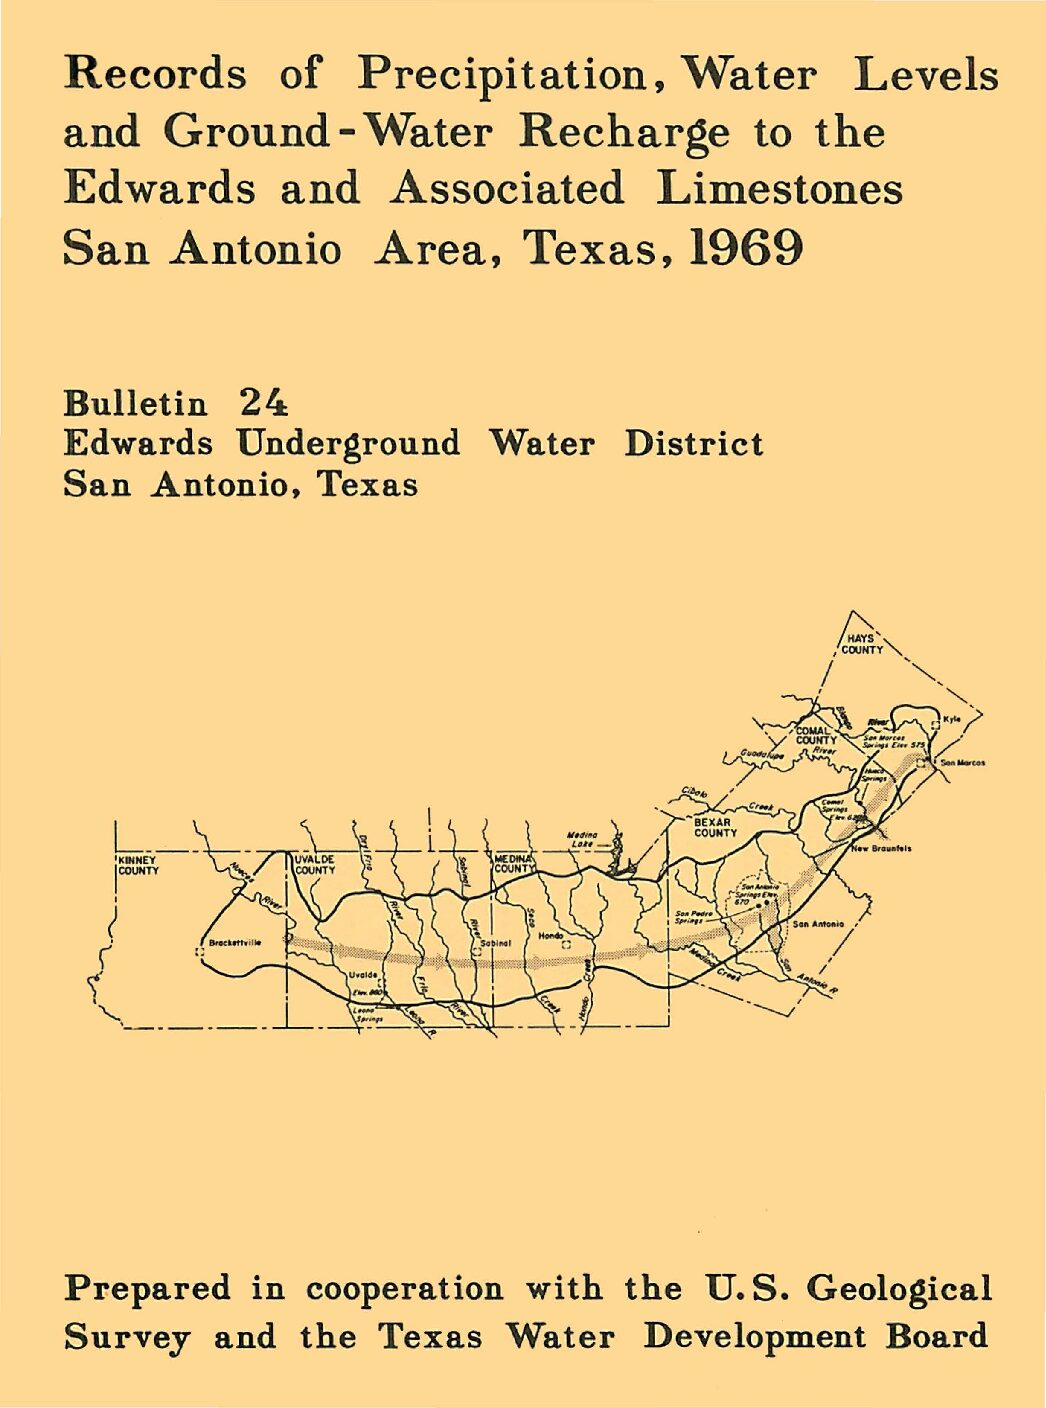
Description: Annual report for 1969 on precipitation, aquifer levels, and recharge to the Edwards Aquifer issued by the Edwards Underground Water District
Report Number: Bulletin 24
Location: Edwards Aquifer Balcones Fault Zone San Antonio Segment
Summary:Records of precipitation, water levels, and estimates of recharge to the Edwards and associated limestones in the San Antonio area during 1969 are summarized in this report. The compilation of these basic records is part of a continuing hydrologic investigation by the U. S. Geological Survey in cooperation with the Edwards Underground Water District and the Texas Water Development Board. Previous reports are given in the list of references.
The annual precipitation at selected stations throughout the San Antonio area for 1969 and the annual average for each of these stations are shown in table 1. Rainfall was above average throughout the recharge area during 1969.
The recorded high and low water levels in five selected key wells during 1969 are shown in table 2. During the year, the water levels fluctuated just below the record high. The record highs and lows are also given in table 2. Ground-water storage in the Edwards limestone was above average during 1969.
Recharge to the Edwards and associated limestones is chiefly from streams that lose most of their base blow and a part of their flood flow as they cross the Balcones Fault Zone on the outcrop of the aquifer. The recharge is estimated from discharge records at gaging stations located above and below the infiltration areas on most of the streams. The monthly mean discharge at the gaging stations for October-December 1969 is given in table 3. Streamflow records for JanuarySeptember 1969 will be published by the U.S. Geological Survey in late 1970.
The recharge in each basin of the San Antonio area for 1969 and the average annual recharge for the period 1934-68 are given in table 4. The basic methods employed by Petitt and George (1956) and by Garza (1962) were used for estimating the 1969 recharge.
Springflow from the Edwards Plateau was the main source of recharge during the first nine months of 1969, while floods during the last three months furnished the main source of recharge. The total recharge was about 10 percent above the average annual (see table 4).
Records of Precipitation, Aquifer Head, and Ground-Water Recharge to the Edwards and Associated Limestones, San Antonio Area, Texas, 1968
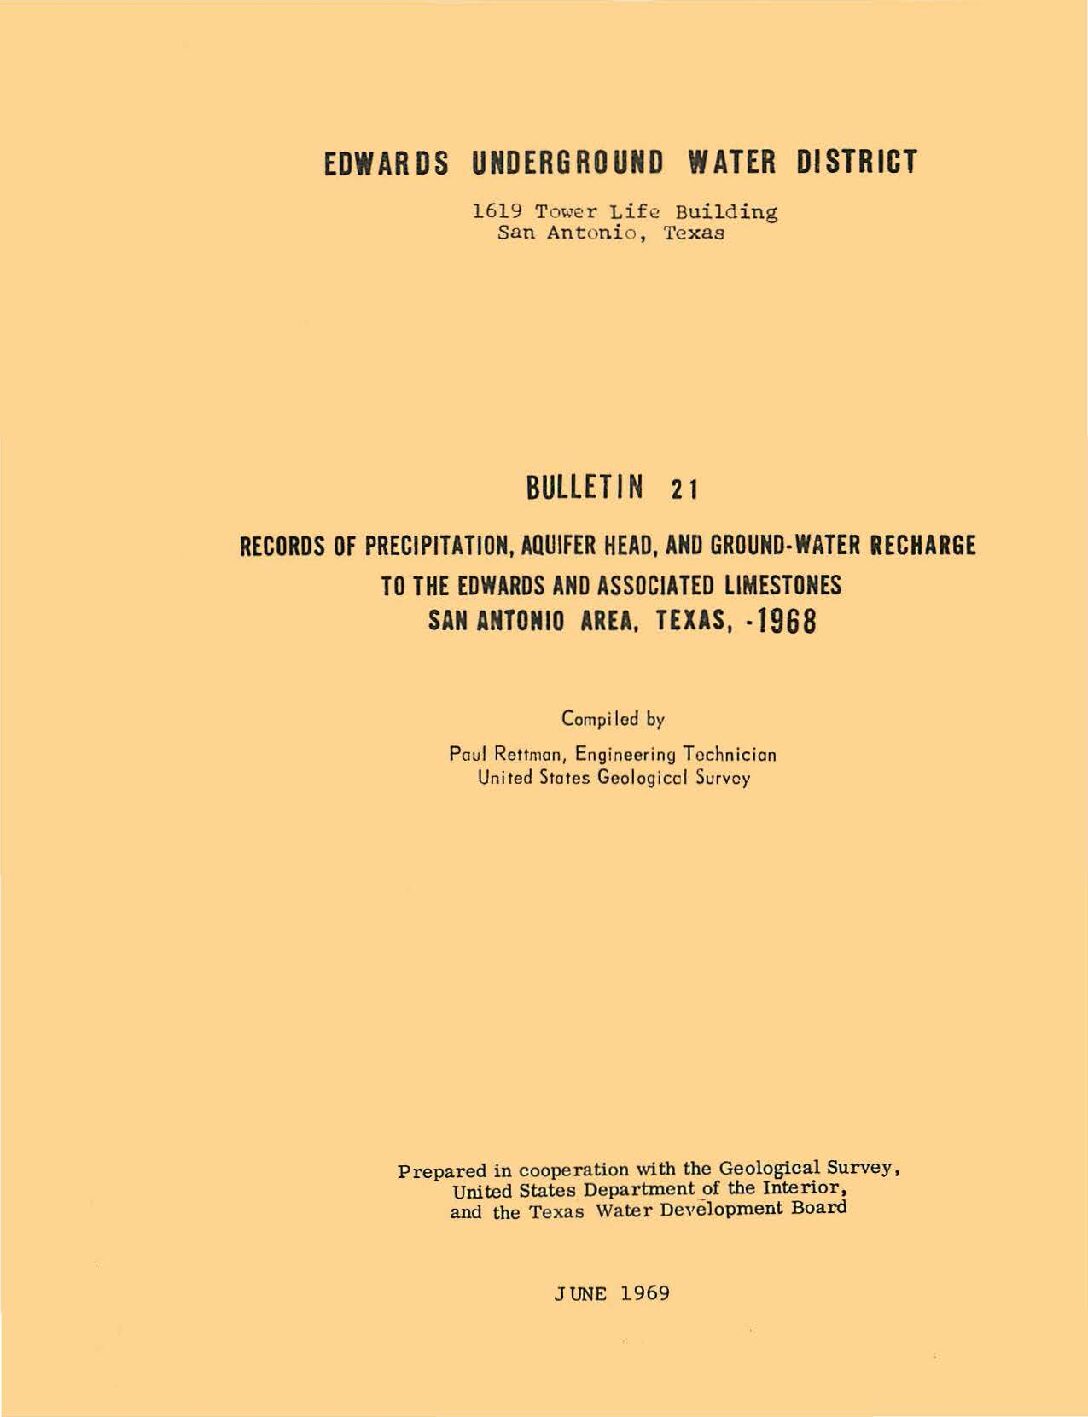
Description: Annual report for 1968 on precipitation, aquifer levels, and recharge to the Edwards Aquifer issued by the Edwards Underground Water District
Report Number: Bulletin 21
Location: Edwards Aquifer Balcones Fault Zone San Antonio Segment
Summary:The Edwards and associated limestones, the principal aquifer in the San Antonio area, has been the subject of numerous geologic and hydrologic reports. Records of precipitation, water levels, and estimates of recharge to the aquifer during 1967 are summarized in this report, which is part of the basic-data collection published by the Edwards Underground Water District. The compilation of these basic records (and data} is part of the continuing hydrologic investigation by the Uo S. Geological Survey in cooperation with the Edwards Underground Water District and the Texas Water Development Board.
The annual precipitation at selected stations throughout the San Antonio area for 1967 and the annual average for each of these stations are shown in table 1. Rainfall was generally deficient for the first eight months of 1967 and excessive during the remainder of the year.
The recorded high and low water levels in five selected key wells during 1967 are shown in table 2. During the year, the water levels fluctuated near the midpoint between the record high and low levels which are also shown in table 2. Ground water storage and water levels in the Edwards limestone reached a lower point during August than had been experienced for several years.
Recharge to the Edwards and associated limestones is chiefly from streams which lose most of their base flow and a part of their floodflow as they cross the Balcones fault zone on the outcrop of the aquifer. The recharge is estimated from discharge records at gaging stations located above and below the infiltration areas on most of the streams. The monthly mean discharge at the gaging stations for October-December 1967 are shown in table 3. Streamflow records for January-September 1967 are being published by the U. S. Geological Survey (U. s. Department of the Interior, 1967).
The recharge in each basin of the San Antonio area for 1967 and the average annual recharge for the period 1934-66 are shown in table 4. The basic methods employed by Petitt and George (1956) and by Garza (1962) were used for estimating the 1967 recharge, which was below the average annual. In September 1967, the deficient rainfall pattern was broken by the rains that accompanied Hurricane Beulah. Seventy-five percent of the total recharge for 1967 occurred during the last four months of the year.
Evaluation of the Option to Designate a Separate San Marcos Pool for Critical Period Management

Description: Hydrogeologic relationships between nearby streams and rivers to springflow at San Marcos Springs
Report Number: 1-Aug
Location: San Marcos Springs
Summary:This report presents the findings of the Edwards Aquifer Authority's investigation into the hydrogeology and hydrodynamics of water discharging from San Marcos Springs in Hays County, Texas. The purpose of the report is to determine whether there is sufficient technical justification for distinct aquifer management rules for the designation of a San Marcos Pool in the San Marcos area regarding critical period management. Historical records indicate that Comal Springs and San Marcos Springs respond differently to rainfall, which could indicate that these springs represent separate hydrologic subbasins or pools within the San Antonio Segment of the Balcones Fault Zone Edwards Aquifer. The report concludes that water for both San Marcos Springs and Comal Springs is derived from the western portion of the aquifer. Groundwater flows through the Artesian fault block and either discharges from Comal Springs or bypasses Comal Springs and discharges at San Marcos Springs. At higher discharge rates, San Marcos Springs is also recharged by water infiltrating from Cibolo Creek, the Guadalupe River, Dry Comal Creek, Sink Creek, and other streams, especially when a groundwater mound forms under Onion Creek. Despite the large volume of water that these streams carry at times, they contribute relatively small amounts to San Marcos springflow. The report concludes that there is not sufficient technical justification at this time to create a separate San Marcos Pool and recommends that an index well be established in the San Marcos area for triggering critical period levels. The report was prepared by Authority staff in February 2008.
Records of Precipitation, Aquifer Head, and Ground-Water Recharge to the Edwards and Associated Limestones, San Antonio Area, Texas, 1967
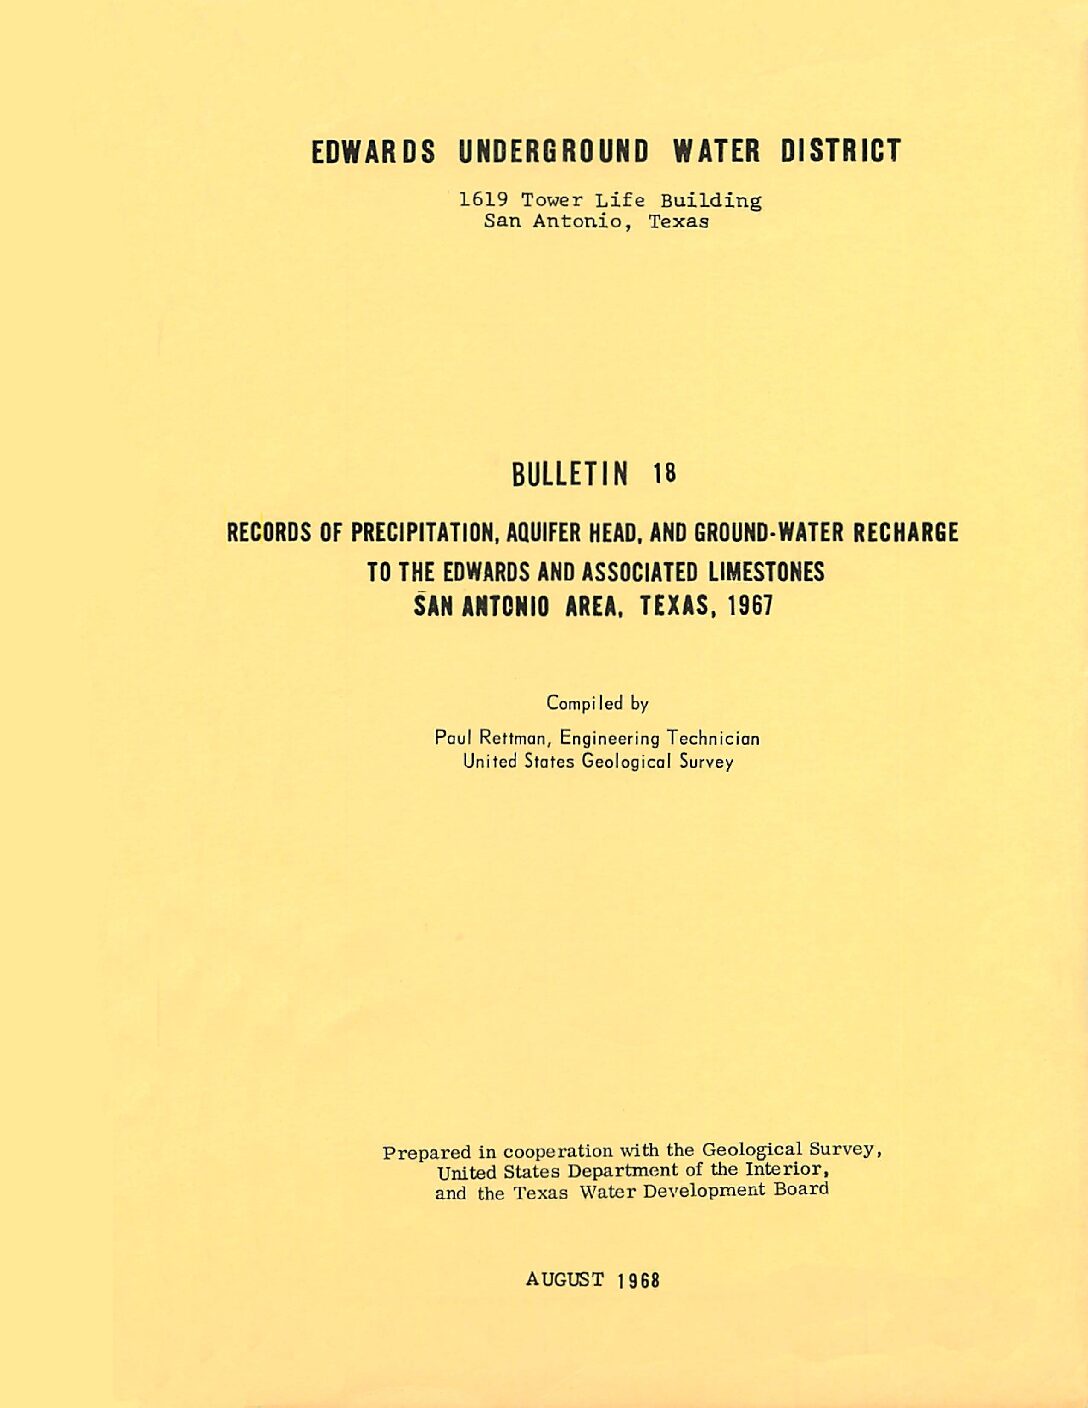
Description: Annual report for 1967 on precipitation, aquifer levels, and recharge to the Edwards Aquifer issued by the Edwards Underground Water District
Report Number: Bulletin 18
Location: Edwards Aquifer Balcones Fault Zone San Antonio Segment
Summary:The Edwards and associated limestones, the principal aquifer in the San Antonio area, has been the subject of numerous geologic and hydrologic reports. Records of precipitation, water levels, and estimates of recharge to the aquifer during 1967 are summarized in this report, which is part of the basic-data collection published by the Edwards Underground Water District. The compilation of these basic records (and data} is part of the continuing hydrologic investigation by the Uo S. Geological Survey in cooperation with the Edwards Underground Water District and the Texas Water Development Board.
The annual precipitation at selected stations throughout the San Antonio area for 1967 and the annual average for each of these stations are shown in table 1. Rainfall was generally deficient for the first eight months of 1967 and excessive during the remainder of the year.
The recorded high and low water levels in five selected key wells during 1967 are shown in table 2. During the year, the water levels fluctuated near the midpoint between the record high and low levels which are also shown in table 2. Ground water storage and water levels in the Edwards limestone reached a lower point during August than had been experienced for several years.
Recharge to the Edwards and associated limestones is chiefly from streams which lose most of their base flow and a part of their floodflow as they cross the Balcones fault zone on the outcrop of the aquifer. The recharge is estimated from discharge records at gaging stations located above and below the infiltration areas on most of the streams. The monthly mean discharge at the gaging stations for October-December 1967 are shown in table 3. Streamflow records for January-September 1967 are being published by the U. S. Geological Survey (U. s. Department of the Interior, 1967).
The recharge in each basin of the San Antonio area for 1967 and the average annual recharge for the period 1934-66 are shown in table 4. The basic methods employed by Petitt and George (1956) and by Garza (1962) were used for estimating the 1967 recharge, which was below the average annual. In September 1967, the deficient rainfall pattern was broken by the rains that accompanied Hurricane Beulah. Seventy-five percent of the total recharge for 1967 occurred during the last four months of the year.
Records of Precipitation, Aquifer Head, and Ground-Water Recharge to the Edwards and Associated Limestones, San Antonio Area, Texas, 1966
Description: Annual report for 1966 on precipitation, aquifer levels, and recharge to the Edwards Aquifer issued by the Edwards Underground Water District
Report Number: Bulletin 15
Location: Edwards Aquifer Balcones Fault Zone San Antonio Segment
Summary:The Edwards and associated limestones, the principal aquifer in the San Antonio area, has been the subject of numerous geologic and hydrologic reports. Records of precipitation, water levels, and estimates of recharge to the aquifer during 1966 are summarized in this report, which is one of three basic-data reports published yearly by the Edwards Underground Water District. The gathering of these records (and data) is part of the continuing hydrologic investigation by the U.S. Geological Survey in cooperation with the Edwards Underground Water District, the Texas Water Development Board, and the city of San Antonio.
Table 1 shows the annual precipitation at selected stations throughout the San Antonio area for 1966 and the annual average for each of these stations. Most of the area stations for 1966 show rainfall to be below the long-term mean.
The recorded high and low water levels during 1966 in five selected key wells are shown in table 2. In 1966, the water levels fluctuated near or above the midpoint between the record high and low levels which are also shown in table 2. Ground water storage in the Edwards Limestone remained high, although rainfall in 1966 was below average.
Recharge to the Edwards and associated limestones is chiefly from streams which lose most of their base flow and a part of their flood flow as they cross the Balcones fault zone on the outcrop of the aquifer. The recharge is estimated from records of continuous discharge at gaging stations located above and below the infiltration areas in each of most of the streams. The monthly mean discharges at the gaging stations during October-December 1966 are shown in table 3. Streamflow records for January-September 1966 have been published by the U. S. Geological Survey (U. S. Department of the Interior, Geological Survey, Water Resources Division, 1966).
Table 4 shows the recharge in each basin of the San Antonio area for 1966 and the average annual recharge for the period 1934-65. The basic methods employed by Petitt and George (1956) and by Garza (1962) were used for estimating the 1966 recharge, which was well above the annual average. On August 13, 1966, greater than 10 inches of rain fell in the upper watersheds of the Nueces and Frio Rivers. This was followed by moderate rains during September. Recharge from the Nueces and Frio Rivers during August and September was 180 thousand acre-feet or 30 percent of all recharge for 1966. During these two months, the Nueces and Frio Rivers discharged 110 thousand acre-feet past the recharge area due to the high rainfall intensity.
Tracer Test Work Plan, Kinney and Uvalde Counties
Description: Plan for dye tracer studies in Kinney and Uvalde Counties
Location: Edwards Aquifer, Balcones Fault Zone, San Antonio Segment, Kinney County, Uvalde County, Recharge Zone, Artesian Zone
Summary:This Work Plan was prepared by Authority staff and defines the scope of work and the methodology that will be followed during tracer testing in Kinney and Uvalde counties.
Groundwater movement in the Edwards Aquifer has been characterized primarily by well data, potentiometric surface mapping, and computer modeling. While each of these techniques provides useful information, tracer testing has long been demonstrated as one of the most effective tools in quantifying groundwater movement in karst aquifers. Tracer testing provides empirical data on groundwater behavior that can be used to delineate drainage basins, identify groundwater flowpaths, and measure groundwater velocities, dilution, dispersion, and storage. The results are far more meaningful and accurate when compared to similar results produced by computer groundwater modeling.
The focus of this test is to investigate the sources of water for the principal springs in Kinney and Uvalde counties. Included in the study will be Pinto, Mud, and Las Moras springs in Kinney County and Leona Springs in Uvalde County. This test will be conducted under the auspices of the Edwards Aquifer Authority (Authority) and its contractor, George Veni and Associates.
This work plan describes the procedures that the Authority typically implements for tracer tests in the Edwards Aquifer. It is based on the Authority's knowledge of the groundwater conditions and the objective of obtaining scientifically valid results. Each activity within the work plan is affected by the results of the preceding work. For example, the results of the initial tracer injections will form the basis for planning subsequent injections. Consequently, some activities described in this work plan may be changed or omitted during the course of the tracer test. The Authority will prepare a report at the conclusion of the test to describe the actual methodology and findings.
The report by Green and Others (2006) on groundwater resources in Uvalde and Kinney counties recommended a series of tracer tests to test the conclusions in the report. The objective of this tracer test study is to test the conclusions of the SWRI study by:
- Evaluating the groundwater flowpaths in the Kinney/Uvalde County area.
- Evaluating the hydraulic characteristics of the Edwards Aquifer.
This work plan outlines a tracer test methodology for evaluation of the time-of-travel, direction, and destination of groundwater movement in a portion of the Kinney and Uvalde portions of Edwards Aquifer recharge and artesian zones. This section outlines the tasks and strategy to be implemented.
Appendix A provides the project quality assurance and quality control (QA/QC) sampling protocols, as prepared by the Authority. Appendix B is a glossary of terms for this work plan. Appendix C is a conversion index from the International System of Units used in this report, to English units. Appendix D is a legend of cave map symbols.
Review of Hydrocarbon Transmission Lines Crossing the Edwards Underground Reservoir
Description: Risk assessment on the likelihood of leaks from oil pipelines over the Edwards Aquifer
Location: Edwards Aquifer - General
Summary:Although little information has been reported on contamination of groundwater from crude oil trunk pipelines, the significance of these pipelines cannot be minimized. Hydrocarbon transmission lines are of primary importance in the consideration of contamination potential. Four of these main trunk lines cross the Edwards Underground Reservoir (EUR) for a total length of 237 miles. These lines cross drainage basins which provide an estimated annual recharge of 20 percent to the total Edwards Aquifer. Limestone aquifers such as the Edwards afford little or no filtration capability to protect groundwater from hydrocarbon transmission line leaks or spills.
After surveying past experience associated with pipeline leaks, it was decided that the U.S. experience was an inadequate data base for predictive analysis; a review of Texas pipeline-related data provided a more adequate source of comparison. There have been nine reported leaks in the EUR from 1970 to the present (September 1976) with corrosion being the primary cause of such leaks. The total reported leaks in Texas from 1973 to 1975 were 1320; of these, 1008 were the result of crude oil pipeline corrosion. Pipelines crossing the EUR have experienced a significantly lower rate of leaks than pipelines over the rest of Texas. The EUR rate is less than 12 percent of the total Texas rate, and too few EUR leaks have occurred to indicate differences in causal factors of these failures. The 1975 Texas failure rate was determined to be 49.79 leaks/ 1000 miles/year while the EUR rate was determined to be 6.33 leaks/ 1000 miles/year. (A lognormal distribution provided the best model for the gross loss spill volume obtained from the total Texas data.)
Further study and assessment produced these additional conclusions concerning future hydrocarbon transmission line leaks:
( l) Using the pessimistic Texas rate assumption, there is a near certainty of at least one oil leak over the EUR each year. By using the EUR rate, there is a 77-percent chance of one or more leaks occurring in a year; thus, it is likely that one or more leaks will continue to occur over the EUR in most years.
(2) For both the U.S. and Texas crude oil pipeline leak experience, there is a trend of decreasing accidents in recent years.
(3) Using the Texas rate assumption, the largest leak over the EUR is likely (about a 61-percent probability) to be between 100 and 499 barrels for a 1-year period. Using the EUR rate, the largest spill is expected to be less than 100 barrels (69-percent probability) for the same time period.
( 4) Using the Texas rate assumption, there is a high probability of the cumulative spill volume exceeding 1000 barrels for a time period of several years. The EUR rate indicates that the possibility of such a large spill volume is not too great for time periods of less than I 0 years.
(5) Assuming that the EUR leak rate remains at its recent level (not considering the apparent
trend in decreasing leak numbers), a sizable volume (2501to 6500 barrels) of crude oil is likely to be spilled over the EUR over a 20-year period.
( 6) The probability of a single leak greater than 10,000 barrels is negligible (0.1 percent) even for a 20-year time period using the EUR failure rate.
(7) The predicted impact of small leaks (0 to 100 barrels) in nonstream and intermittent stream areas on the aquifer would be minimal.
(8) The effect of a small leak entering a stream would likely be to cause oil to enter the aquifer.
(9) The predicted impact of a large leak in nonstream areas of the aquifer is minimal because of the physical distance from the streams.
(10) The predicted impact of a large leak on an intermittent or flowing stream on the aquifer is likely to be severe.
As of this date, the Texas Water Quality Board (TWQB) has not established specifications for the construction of new pipelines crossing the Edwards Aquifer recharge zone. The four companies presently operating the pipelines crossing the EUR function under Federal Department of Transportation rules and regulations applicable to interstate transmission lines. Furthermore, based on the data generated by this study, the need for pipeline retrofit modification on existing pipelines does not appear to be justified at this time .
Records of Precipitation, Aquifer Head, and Ground-Water Recharge to the Edwards and Associated Limestones, San Antonio Area, Texas, 1965
Description: Annual report for 1965 on precipitation, aquifer levels, and recharge to the Edwards Aquifer issued by the Edwards Underground Water District
Report Number: Bulletin 12
Location: Edwards Aquifer Balcones Fault Zone San Antonio Segment
Summary:The Edwards and associated limestones, the principal aquifer in the San Antonio area, has been the subject of numerous geologic and hydrologic reports. Records of precipitation, water levels, and estimates of recharge to the aquifer during 1965 are summarized in this report, which is one of three basic-data reports published yearly by the Edwards Underground Water District. The gathering of these records (and data) is part of the continuing hydrologic investigation by the U. S. Geological Survey in cooperation with the Edwards Underground Water District, the Texas Water Development Board, and the city of San Antonio.
Table 1 shows the annual precipitation at selected stations throughout the San Antonio area for 1965 and the annual average for each of these stations. Rainfall was slightly above average in the western part of the area to moderately heavy in the eastern part of the area.
The recorded high and low water levels during 1965 in five selected key wells are shown in table 2. In 1965, the water levels fluctuated above the midpoint between the record high and low levels which are also shown in table 2. Because of the above-average rainfall in 1965, the aquifer head in the eastern part of the aquifer increased to levels generally higher than those of 1962 and 1963 (Garza, 1963, p. 4; Garza, 1964, p. 3).
Recharge to the Edwards and associated limestones is chiefly from streams that lose most of their base flow and a part of their flood flow as they cross the Balcones fault zone on the outcrop of the aquifer. The recharge is estimated from records of continuous discharge at gaging stations located above and below the infiltration areas in each of most of the streams . The monthly mean discharges at the gaging stations during October-December 1965 are shown in table 3. Streamflow records for January-September 1965 have been published by the U.S. Geological Survey (U. S. Department of the Interior, Geological Survey, Water Resources Division, 1965).
Table 4 shows the recharge in each basin of the San Antonio area for 1965 and the average annual recharge for the period 1934-64. The recharge estimates for 1934- 64 were taken from an open-file report (to be published by the Texas Water Development Board) on the 1960- 64 studies of the Edwards and associated limestones by Sergio Garza. The basic methods employed by Petitt and George (1956) and by Garza (1962; open- file report) were used for estimating the 1965 recharge, which was well above the annual average. During 1965, the basin areas of Cibolo and Dry Comal Creeks received over 18 percent of the total recharge, and nearly 38 percent of this total took place during the May-June floods.
Valdina Farms Sinkhole: Hydrogeologic & Biologic Evaluation
Fauna of Wells Near the Saline Water line of the Edwards Aquifer, Texas
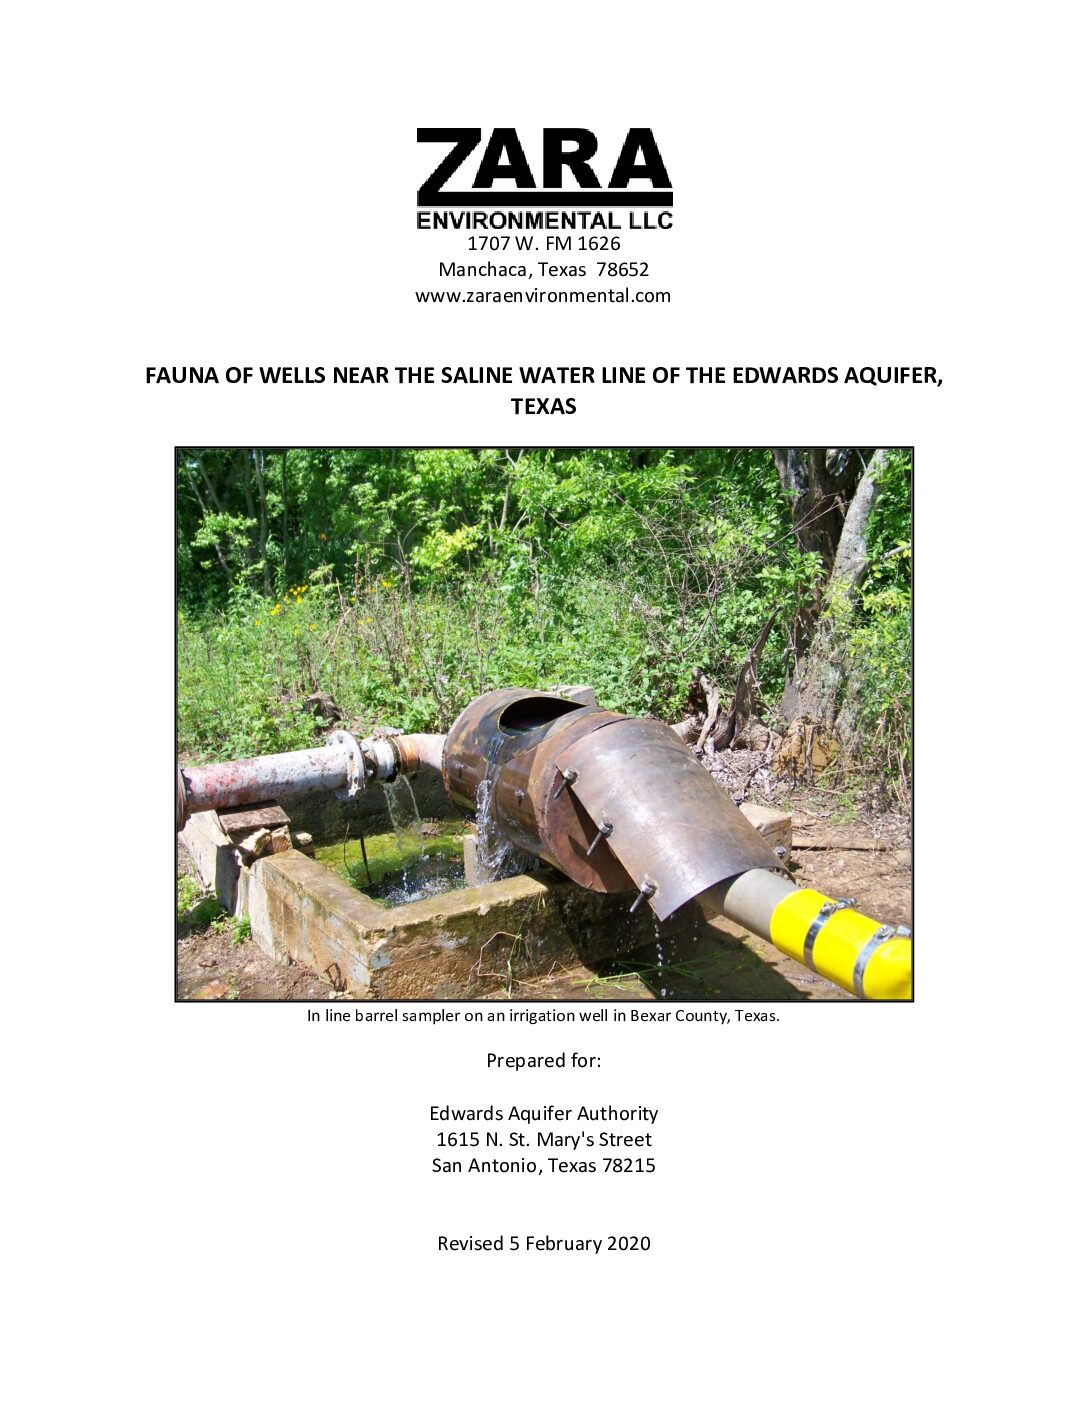
Description: Zara Deep Aquifer Biota Study of Fauna of Wells Near the Saline Water line of the Edwards Aquifer
Location: Edwards Aquifer, Balcones Fault Zone, San Antonio Segment, Uvalde County, Medina County, Bexar County, Comal County, Hays County
Summary:The Edwards Aquifer Authority contracted with Zara Environmental LLC, to perform a three-year study to document the current status and distribution of organisms in the artesian portion of the Edwards Aquifer. This is the second major sampling effort in the artesian portion of the aquifer and the first one completed in more than 30 years.
This report documents the findings of the study. Twelve sites ranging from 111 to 652 meters in depth yielded invertebrate fauna, including 22 unique taxa in eight orders. In addition, three new localities for the toothless blindcat were found. One represented a six kilometer range extension to the southwest.
Effects of Brush Management on the Hydrologic Budget and Water Quality In and Adjacent to Honey Creek State Natural Area, Comal County, Texas, 2001-10
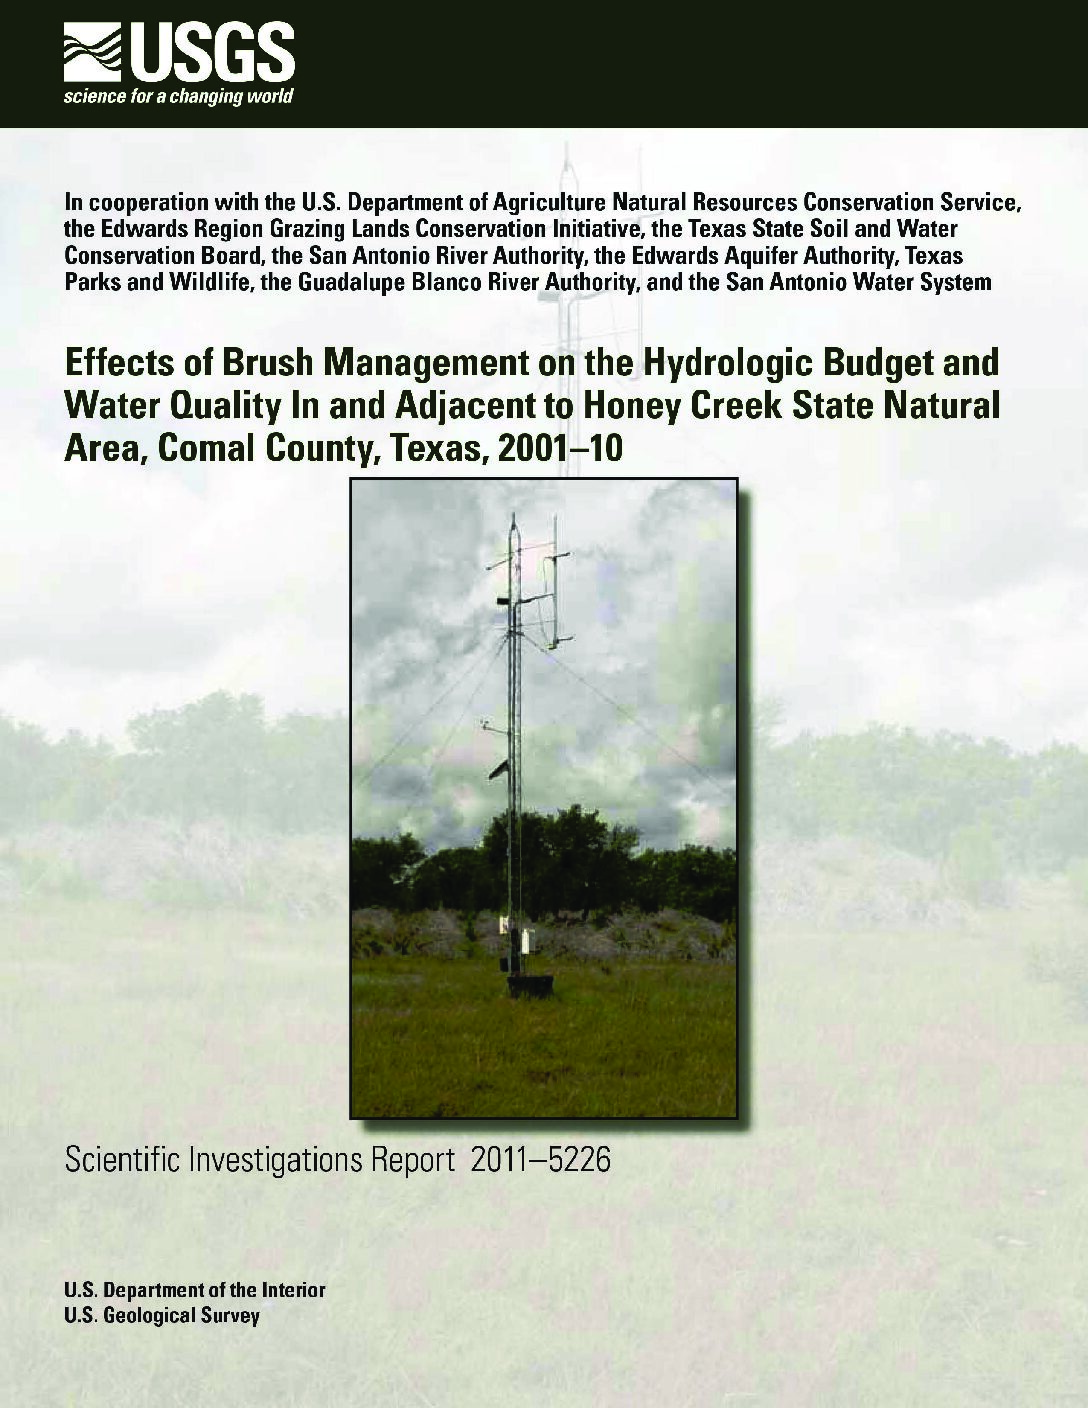
Description: Effects of brush management on hydrologic budget and water quality. May not be generalizable to all locations. See Fact Sheet companion document of the same name.
Report Number: USGS SIR 2011-5226
Location: Comal County, Honey Creek State Natural Area
Summary:Note: May not be generalizable to all locations. See Fact Sheet companion document of the same name.
The U.S. Geological Survey, in cooperation with the U.S. Department of Agriculture Natural Resources Conservation Service, the Edwards Region Grazing Lands Conservation Initiative, the Texas State Soil and Water Conservation Board, the San Antonio River Authority, the Edwards Aquifer Authority, Texas Parks and Wildlife, the Guadalupe Blanco River Authority, and the San Antonio Water System, evaluated the hydrologic effects of ashe juniper (Juniperus ashei) removal as a brush management conservation practice in and adjacent to the Honey Creek State Natural Area in Comal County, Tex.
By removing the ashe juniper and allowing native grasses to reestablish in the area as a brush management conservation practice, the hydrology in the watershed might change. Using a simplified mass balance approach of the hydrologic cycle, the incoming rainfall was distributed to surface water runoff, evapotranspiration, or groundwater recharge. After hydrologic data were collected in adjacent watersheds for 3 years, brush management occurred on the treatment watershed while the reference watershed was left in its original condition. Hydrologic data were collected for another 6 years. Hydrologic data include rainfall, streamflow, evapotranspiration, and water quality. Groundwater recharge was not directly measured but potential groundwater recharge was calculated using a simplified mass balance approach. The resulting hydrologic datasets were examined for differences between the watersheds and between pre- and post-treatment periods to assess the effects of brush management. The streamflow to rainfall relation (expressed as event unit runoff to event rainfall relation) did not change between the watersheds during pre- and posttreatment periods. The daily evapotranspiration rates at the reference watershed and treatment watershed sites exhibited a seasonal cycle during the pre- and post-treatment periods, with intra- and interannual variability. Statistical analyses indicate the mean difference in daily evapotranspiration rates between the two watershed sites is greater during the post-treatment than the pre-treatment period. Average annual rainfall, streamflow, evapotranspiration, and potential groundwater-recharge conditions were incorporated into a single hydrologic budget (expressed as a percentage of the average annual rainfall) applied to each watershed before and after treatment to evaluate the effects of brush management. During the posttreatment period, the percent average annual unit runoff in the reference watershed was similar to that in the treatment watershed, however, the difference in percentages of average annual evapotranspiration and potential groundwater recharge were more appreciable between the reference and treatment watersheds than during the pre-treatment period. Using graphical comparisons, no notable differences in major ion or nutrient concentrations were found between samples collected at the reference watershed (site 1C) and treatment watershed (site 2C) during pre- and post-treatment periods. Suspended sediment loads were calculated from samples collected at sites 1C and 2T. The relation between suspended sediment loads and streamflow calculated from samples collected from sites 1C and 2T did not exhibit a statistically significant difference during the pre-treatment period, whereas during the post-treatment period, relation between suspended-sediment loads and streamflow did exhibit a statistically significant difference. The suspended sediment load to streamflow relations indicate that for the same streamflow, the suspended sediment loads calculated from site 2T were generally less than suspended-sediment loads calculated from site 1C during the post-treatment period.
Threatened and endangered plant and animal species of the Edwards Aquifer
Description: Description, distribution, habitat, feeding and breeding requirements of seven species of the Edwards Aquifer listed by the United States Fish & Wildlife Service and/or Texas Parks and Wildlife Department as Threatened or Endangered as of 1995. Note: this document is included for its historical value and may have been superseded by more recent classifications and publications.
Location: Edwards Aquifer
Summary:Description, distribution, habitat, feeding and breeding requirements of seven species of the Edwards Aquifer listed by the United States Fish & Wildlife Service and/or Texas Parks and Wildlife Department as Threatened or Endangered as of 1995. Note: this document is included for its historical value and may have been superseded by more recent classifications and publications.
Aquatic Vegetation Laboratory Study: Phase 1: Observations of water quality changes and plant growth under various flows. Phase 2: Effects of carbon dioxide level on aquatic plants found in the Comal and San Marcos Springs/River Ecosystems. Final Report Variable Flow Study: Project 802, Task 27 San Marcos National Fish Hatchery & Technology Center, San Marcos, Texas
Fountain Darter Laboratory Study Reproductive Response to Parasites and Temperature Fluctuations
Description: Laboratory study of effects of temperature fluctuations and parasites on reproduction in the fountain darter
Report Number: Southwest Texas State University Variable Flow Study: Project 802, Task 18
Location: Comal River, San Marcos River [Laboratory]
Summary:[from the Executive Summary]
The following study was conducted by Dr. Timothy Bonner (Southwest Texas State University) to examine with a controlled laboratory experiment the effect of fluctuating temperatures and cercariae (parasite) infestation on total egg, healthy egg, and larval production. Temperatures included a constant 24°C, fluctuating 24 to 26°C, fluctuating 26 to 28°C, and fluctuating 28 to 30°C; all fluctuations were on a 12h day, 12h night cycle. These temperatures were chosen because the lowest level falls within the range of temperatures commonly found in fountain darter habitats. The next two treatments had temperatures that may potentially be reached during low-flow/high temperature periods (~26°C); the last treatment included a range above the worst-case scenario to evaluate the potential improvement with the 2°C diel fluctuation. Dr. Bonner's report detailing his methods and results is attached.
The first analysis revealed that parasites did not have an effect on egg or larval production, so darters with and without parasites were lumped for all other analyses. This is an important finding of the study. Parasites are a concern in the Comal Springs ecosystem because of high rates of infestation, particularly in areas where the fountain darters are most abundant (old channel). Parasites do not appear to cause mortality directly in the wild (T. Brandt, USFWS, personal communication) but have been assumed to have sub-lethal effects (cause greater stress, reduce predator avoidance, reduce reproductive ability). These results suggest that, at least in the early stages of infestation, there is little effect on reproductive capability. It is possible; however, that long-term infestation or greater parasite loads may have negative effects that were not observed here.
There were significant differences observed between temperature treatments in the number of healthy eggs and larvae produced; the 24°C treatment resulted in significantly more eggs overall, healthy eggs and larvae than any other trial. This is not surprising since this temperature is within the range of mean temperatures found in areas where fountain darters are abundant. The two treatments with increasingly higher temperatures (24-26°C and 26-28°C) had similar numbers (not significantly different) of total eggs and healthy eggs produced, but the number of larvae produced was lower in the 26-28°C treatment. The 28-30°C treatment resulted in virtually zero eggs produced. Although standardizing healthy eggs and larvae produced by percentage of total eggs produced did reveal less significant differences between treatments, the large decline in total egg production between treatments suggests that temperatures in the ranges tested here do have an important effect on reproduction in darters.
Overall, these results do not confirm our initial hypothesis. It appears that, in the laboratory, egg and larval production do not benefit greatly from the 2°C diel fluctuation that fountain darters experience in the wild. As in previous studies, lower egg and larval production was observed at temperatures higher than in controls (23°C and 24°C). Regardless of findings in the laboratory, the results do not necessarily translate directly into conditions occurring in the wild. Other unknown factors may also affect fountain darter health and reproductive capability in the laboratory with increasing temperatures differently than conditions experienced in the wild. Therefore, laboratory results and available field data should be considered jointly to evaluate temperature effects on fountain darter reproduction.


