
 Aquifer Conditions
Science & Data Document Library
Science and Data Resources
1994 Review and Update of the Position of the Edwards Aquifer Freshwater/Saline-Water Interface from Uvalde to Kyle, Texas
Description: 1994 attempt to describe the location of the freshwater/saline-water interface accurately from Kyle to Uvalde, Texas
Report Number: 94-05
Location: Edwards Aquifer Balcones Fault Zone San Antonio Segment, Freshwater/Saline-Water Interface, Kyle, Lytle, Medina County, Uvalde
Summary:This report is the latest attempt to accurately describe the location of the freshwater/saline-water interface from Kyle to Uvalde, Texas. Multiple sources were used to obtain high quality measured specific conductance and total dissolved solids values. All comparisons relating specific conductance to total dissolved solids have shown a high degree of correlation in every area near the interface. Total dissolved solids estimates derived from quantitative geophysical log recordings agree well with actual measurements taken in the same boreholes. The practical use of merged, measured, and calculated data is demonstrated along the interface from Kyle to Lytle. where abundant measured data is observed to be sufficiently distributed among map values generated from geophysical logs. As a result, the revised interface closely parallels former estimates. The changes are dictated by added control and, to a minor degree, by the contour options on the part of the various investigators.
The area from Lytle to Uvalde is lacking an abundant supply of TDS measurements. Therefore, reliance upon TDS estimates obtained from quantitative geophysical log interpretations is necessary. This is especially true in southern Medina County. To verify the major difference between the interface location presented in EUWD Report 92-03, EUWD South Medina Observation Well #I was drilled. This well proved that freshwater was at least three miles south of the commonly accepted freshwater/saline-water interface. This test well data and other additional geophysical logs were used to enhance the TDS and specific conductance maps furnished in EUWD Report 92-03. The TDS map shown in EUWD Report 93-06 has been merged with the TDS map shown in this report (Lytle to Uvalde) to provide the most current interpretation of the freshwater/ saline-water interface position from Kyle to Uvalde, Texas. Accuracy of the interface position west of Lytle is not as sound as that shown for the area east extending to Kyle, Texas. To more precisely determine the freshwater/saline-water interface location between Lytle and Uvalde, acquisition of measured well data, which may have been overlooked in the past, and drilling of additional observation wells will be required. The position of these new wells will be dependent upon the area where the most critical information is required.
Defining the Edwards Aquifer Freshwater/Saline-Water Interface with Geophysical Logs and Measured Data (San Antonio to Kyle, Texas)
Description: Analysis of geophysical logs to define the freshwater/saline water interface in the Edwards Aquifer between San Antonio and Kyle, TX. Note: Large-format versions of the plates for this report are available in a companion document.
Report Number: 93-06
Location: Freshwater/Saline Interface, San Antonio to Kyle
Summary:Note: Large-format versions of the plates for this report are available in a companion document.
One hundred twenty six geophysical logs from locations near and downdip from the current Edwards aquifer freshwater/saline-water interface between San Antonio and Kyle, Texas, were acquired and analyzed. Measured water quality data was obtained from eighty-one water samples taken from wells within the study area. Twenty wells possessed both usable geophysical logs and measured data which were used together to verify a high correlation between estimated and measured water quality parameters. This study and Edwards Underground Water District (EUWD) Reports 92-02 and 92-03 establish good agreement between calculated and measured values of specific conductance and measured and estimated values of total dissolved solids within the study area and near the freshwater/saline-water interface between Uvalde and Kyle, Texas.
The location of the freshwater/saline-water interface derived from this study closely parallels data published by the EUWD, such as EUWD Bulletin 51 (1992), but indicates that there is slightly less area occupied by freshwater than previously shown. Maps presented in this report can be used to infer additional water quality characteristics near the interface such as rate of change of total dissolved solids, concentrations of highly mineralized water, zones of dilution downdip and indications of freshwater flow patterns.
This study suggests that a very large area of moderately saline water exists in eastern Bexar County and western Guadalupe County. The transition from moderately saline water to brine is very rapid near the common corner of Bexar, Atascosa, and Wilson counties. The large area of moderately saline water changes to water containing higher total dissolved solids northward from Guadalupe County toward the San Marcos River. A re-entrant of very saline water, which is subparallel to the San Marcos River, terminates the moderately saline zone in Guadalupe County, extends to the northwest, and is present in the City of San Marcos.
2010 Edwards Aquifer Hydrologic Data Fact Sheet for Precipitation, Groundwater Levels and Drought Conditions
Description: Summary for 2010 on precipitation, groundwater levels, and drought in the Edwards Aquifer San Antonio Region
Location: Edwards Aquifer - Balcones Fault Zone - San Antonio Segment
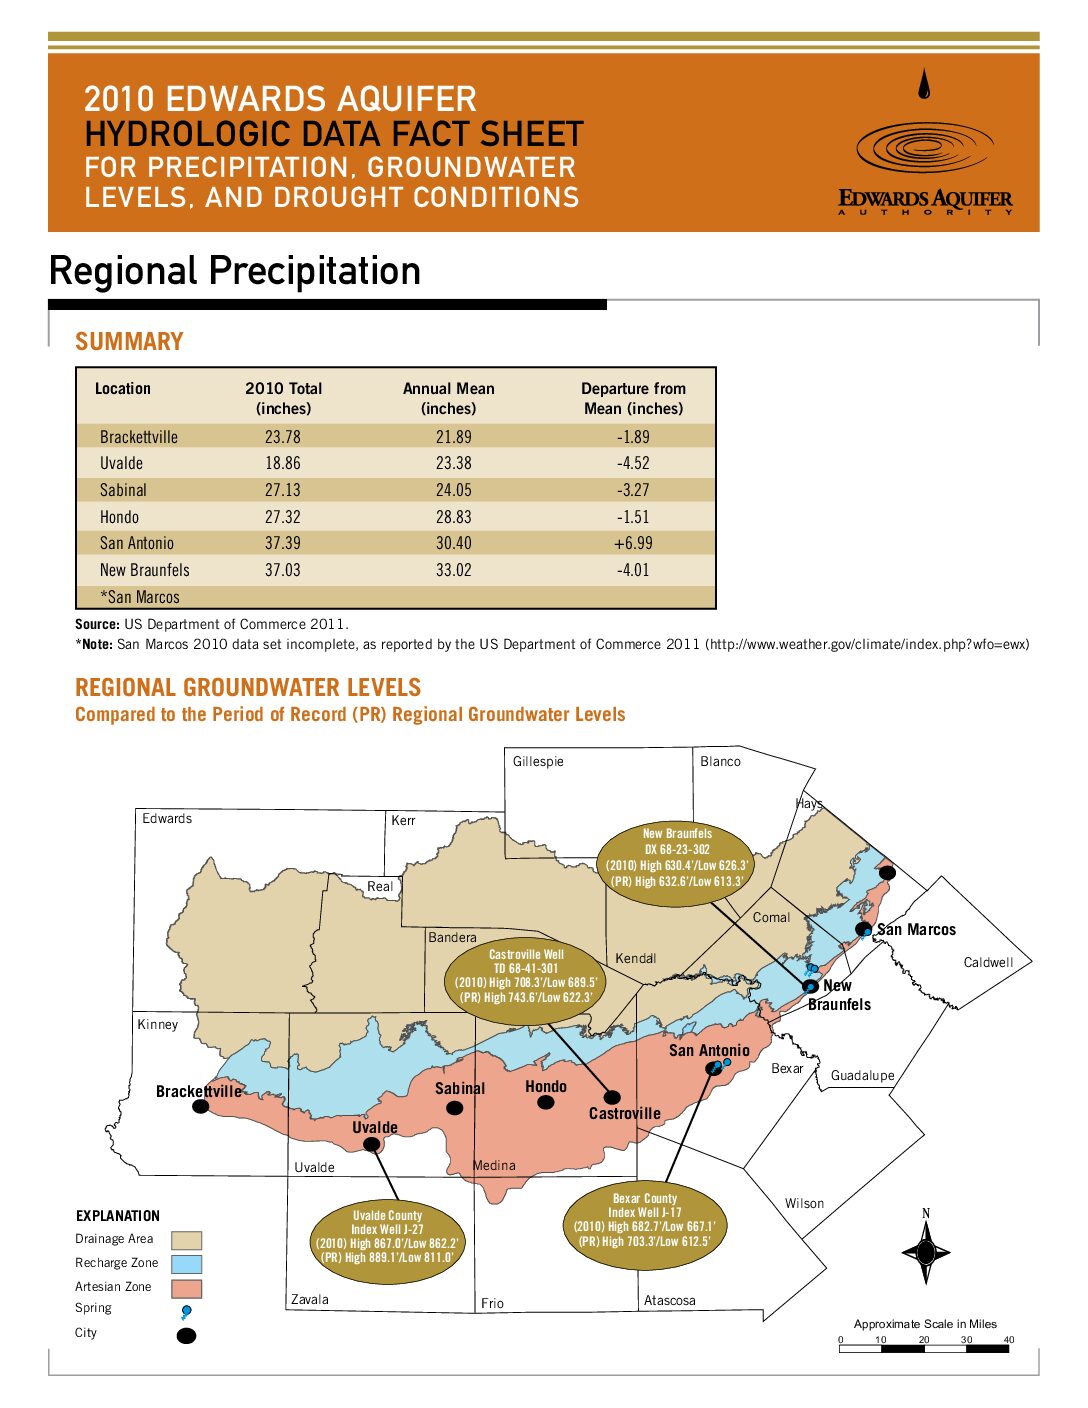
Summary:Each year, the Edwards Aquifer Authority (Authority) publishes a comprehensive Hydrologic Data Report offering an extensive compilation of data on the Edwards Aquifer. This fact sheet is a sampling of the information that can be found in that report.
Refining the Conceptual Model for Flow in the Edwards Aquifer: Characterizing the Role of Fractures and Conduits in the Balcones Fault Zone Segment
Description: Hydrogeologic study using existing data on role of fractures and conduits in groundwater flow in the recharge and artesian zones of the Edwards Aquifer Balcones Fault Zone
Location: Edwards Aquifer, Balcones Fault Zone
Summary:The purpose of this study was to evaluate the influence of fractures and conduits on groundwater flowpaths in the recharge and artesian zones of the Edwards Aquifer. Hydrologic and geologic data were evaluated for evidence of karst aquifer flow regimes and specific areas are delineated for focused data collection in the future. The study was completed in January 2004 by the University of Texas Bureau of Economic Geology, Austin, Texas.
The Balcones Fault Zone Edwards aquifer of South Texas exhibits multimodal permeability. High matrix porosity and permeability are overshadowed by high permeability developed in structurally influenced karstic conduit systems. High permeability is developed in the confined part of the aquifer at depths greater than 4,000 feet below sea level, as well as in the unconfined zone. Optimization of use of this heavily subscribed aquifer requires accurate quantification and realistic mapping of the relationships between the limestone matrix, which stores most of the water, and the conduit system, which transmits water into, through, and out of the aquifer. This balance between storage and drainage is a key variable needed for predicting sustainability of flow during periods of low recharge and heavy use.
The purpose of this study is to interpret and integrate a selection of the existing diverse data to better characterize the conduit system. Data sets selected to feed into this interpretation include (1) water-level data, (2) structural information, (3) cave maps, (4) existing water-chemistry data, and (5) well hydrographs. It is intended that analysis of the existing data will supply hypotheses that will then be tested using field-based followup studies. These might include injected tracers; high frequency, closely spaced water level monitoring; conductivity monitoring; and well testing to better define flow systems.
A regionally extensive system of high-permeability zones is defined by broad troughs in the potentiometric surface in the confined zone. Indications of connections of the confined aquifer to the recharge zone are weakly defined by troughs in the available water-level data. Intersection of the Edwards/Trinity merged potentiometric surface maps with base Edwards structure maps to show that the Edwards Formation is saturated over only a part of the Edwards outcrop zone. This fact suggests that recharge flows through the Edwards into the upper beds of the underlying Glen Rose Formation before returning to the Edwards. Steep gradients of 100 ft/mi are mapped where flow crosses between the Glen Rose and the Edwards Formations, showing that the cross-formational flowpaths are much less transmissive than those in the Edwards confined zone. Spring discharge at the Edwards-Glen Rose contact suggests that perched water tables or flood-stage perched conduits might have a significant role in transmitting water through the recharge zone.
Cave maps show a persistent overprint of vadose-zone karst development, forming near-vertical shafts; however, in the horizontal segments, cave elongation shows that about half the caves are elongated along the principal fault direction. This orientation documents the role of opening-mode fractures parallel to the Balcones Fault Zone trends in controlling permeability. The other half of the horizontally elongated caves trend in other directions, reflecting multiple fracture systems in this structurally complex system.
Local gradient toward a local discharge point is interpreted to be a possible contribution to elongations of some cave patterns.
Water chemistry from Texas Water Development Board (TWDB) files is used as an indicator of flowpath geometry. High-salinity water (>3000 mg/L total dissolved solids [TDS]) indicative of long residence times is found in the deep part of the Edwards aquifer and in parts of the Glen Rose (Trinity) aquifer. These areas are therefore interpreted as regions bypassed by low-TDS recharge water moving through conduits.
Other Trinity samples have salinities in the same range as that of average Edwards water (200 to 500 mg/L) and may indicate faster flowpaths that communicate from the Trinity to the Edwards and from the Edwards recharge zone through the Trinity and back into the Edwards. About 5% of the Edwards waters in the confined Edwards are strongly undersaturated with respect to calcite, interpreted as an indicator of rapid conduit flow that has limited reactions between rock and water. Undersaturated samples are not strongly clustered in the major conduits zones defined by troughs in the potentiometric surface, suggesting that a network of conduits is active, with groundwater velocities adequate to impact chemistries. Samples with reported high (more than 30 mg/L) nitrate in the confined aquifer are tentatively interpreted as indicators of fast flowpaths from surface sources of nitrate; however, well leakage and sample contamination are alternative explanations.
Separation of representative well hydrographs recession curves shows variability in the ratio of matrix to fracture storativity. However, strong rapid drainage characteristic of conduits was not observed in the small population of hydrographs analyzed.
Stormwater Runoff for Selected Watersheds in the Edwards Aquifer Recharge Zone, Bexar County, Texas, 1996-98
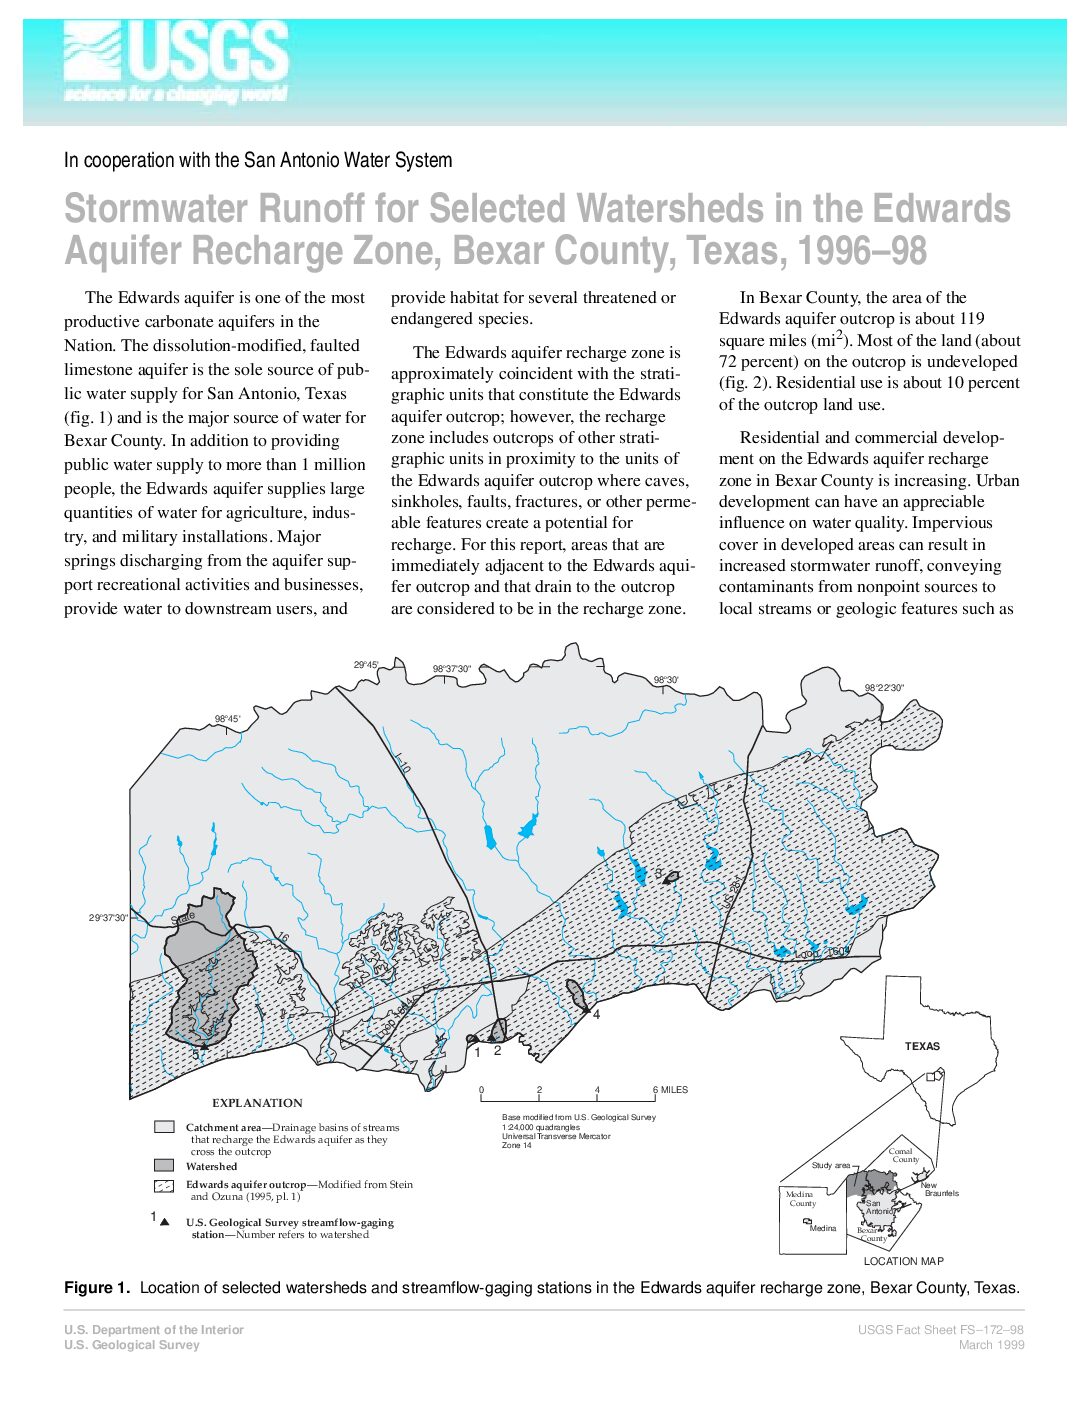
Description: Comparison of water quality in stormwater runoff from five watersheds in the Edwards Aquifer Balcones Fault Zone San Antonio Segment Recharge Zone
Report Number: USGS FS-172-98
Location: Edwards Aquifer Recharge Zone, Bexar County
Summary:In 1996, the U.S. Geological Survey (USGS), in cooperation with the San Antonio Water System, began a study to monitor the quality and quantity of stormwater runoff of five selected watersheds in the Edwards aquifer recharge zone. The purpose of the study is to further the understanding of relations between stormwater and land use and to help resource managers assess the effects of development on the Edwards aquifer recharge zone. Land use is relatively commercial in two of the watersheds and predominantly residential in two of the watersheds; one watershed is largely undeveloped (table 1). This fact sheet provides an overview of the data collection methods and selected results of analysis.
Geology and Water Quality at Selected Locations in the San Antonio Area Texas, Progress Report, 1969
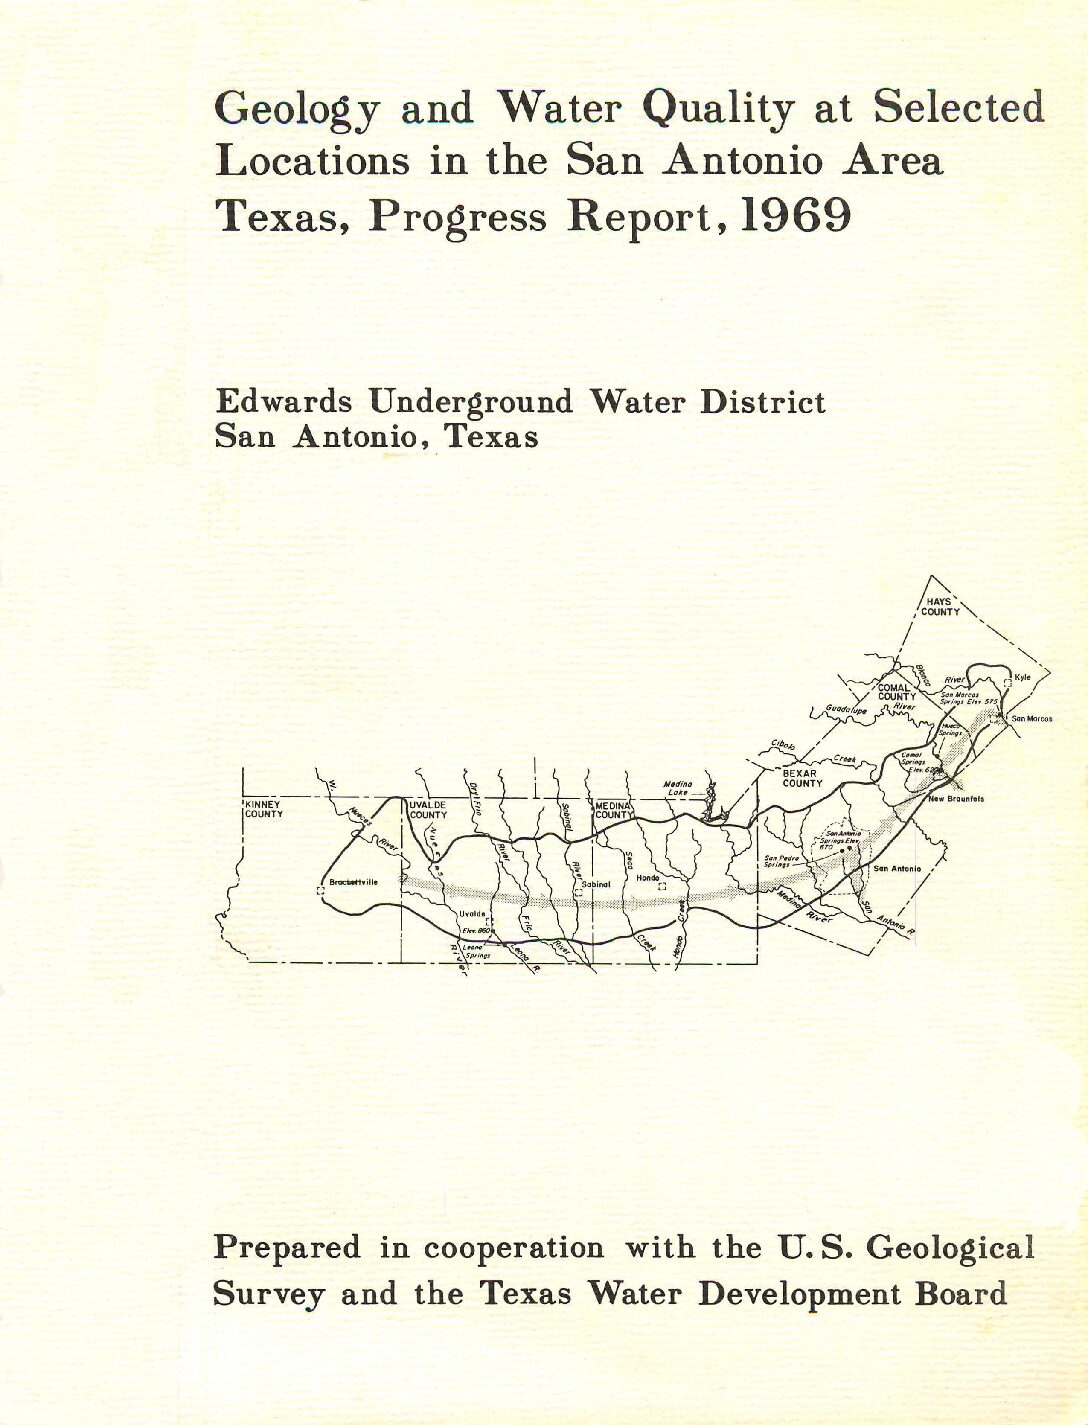
Description: Surface geology and water quality monitoring in the San Antonio region in relation to development and most likely sources of pollution. Note: Page-size and large-format plate are at the end of the report.
Report Number: USGS O-FR70-272
Location: Edwards Aquifer, Balcones Fault Zone, San Antonio Segment
Summary:The Edwards aquifer is the principal source of water supply for the San Antonio area. Increasing urban development on or adjacent to the recharge area of the aquifer is causing great concern because of possible pollution of the ground water. A detailed map of the surface geology has been prepared for areas where the greatest threat of pollution exists. Water-quality data are being collected throughout the San Antonio area to provide background reference information and to detect any current pollution of the ground water in the Edwards and associated limestones.
Mapping of the surface geology will continue in areas where waste waters may be recharging the aquifer. Water-quality data will be collected at additional sites, and some sites will be resampled where pollution may be occurring or where more background data are needed.
Staff report to Board of Directors of the Edwards Underground Water District: Urban Development on the Edwards Aquifer Recharge Zone
Description: EUWD staff recommendations to the EUWD Board regarding potential cumulative impact of development over the Edwards Aquifer Recharge Zone
Report Number: 93-09
Location: Edwards Aquifer, Balcones Fault Zone, San Antonio Segment, Recharge Zone
Summary:A recent increase in development activities on the ERZ [Edwards Aquifer Recharge Zone] has heightened concerns by District staff that the current mechanisms in place to protect the Edwards aquifer from degradation associated with urbanization are not adequate. Staff believes that the cumulative impact on the Edwards aquifer of the various types of development and their associated risks is not currently being addressed. The lack of adequate comprehensive standards and regulatory controls to protect the aquifer against water quality degradation, coupled with the rapid pace of development over the ERZ at this time, and presumably for some time to come, suggests that degradation of water in the Edwards aquifer is imminent. Swift actions to implement more accurate impact assessment procedures and more stringent standards and controls on development activities are crucial if the District is to uphold its enabling legislation and resolutions adopted for the purpose of protecting the quality of the Edwards aquifer.
Report of the Technical Data Review Panel on the Water Resources of the South Central Texas Region
Description: Assessment and gap analysis of the Edwards Underground Water District Technical Data Review Panel on historical data for water use, water quality, and water supply Note: This report is included for its historical value and may have been replaced by more recent studies.
Location: South Central Texas
Summary:The report of the Technical Review Panel is thus intended as a guide to the availability and reliability principally of water quantity, use and supply data. The report does not pretend to offer the correct data. Rather it familiarizes the reader with the underlying methodologies used to collect and/ or to estimate data which arc central to any planning or policy development efforts for the use of Edwards waters. It should be clearer from this review what the data does and does not say and what are the gaps in existing information. A concluding section makes several suggestions for further technical studies to revise particular methodologies, enhance collection efforts or review the uses to which data are put in a policy context.
Hydrogeologic Framework and Geochemistry of the Edwards Aquifer Saline-Water Zone, South-Central Texas
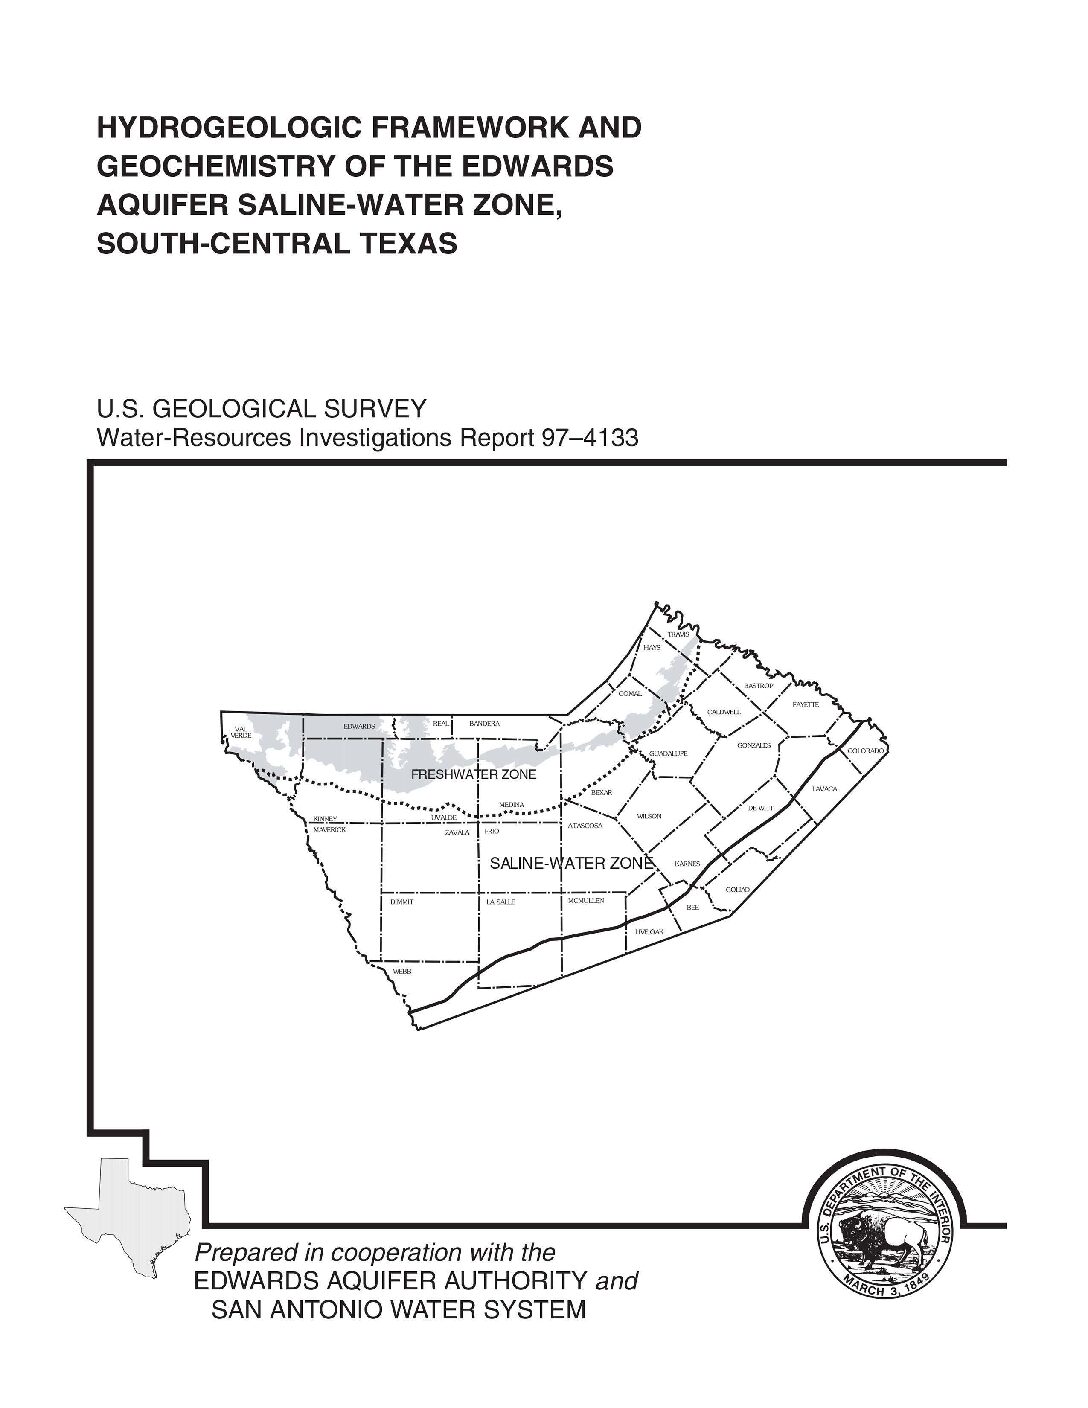
Description: Geochemical study of the Edwards Aquifer saline zone in relation to location of downdip and geological faults
Report Number: USGS WRIP 97-4133
Location: Edwards Aquifer Balcones Fault Zone San Antonio Segment, saline-water zone
Summary:The Edwards aquifer supplies drinking water for more than 1 million people in south-central Texas. The saline-water zone of the Edwards aquifer extends from the downdip limit of freshwater to the southern and eastern edge of the Stuart City Formation. Water samples from 16 wells in the Edwards aquifer saline-water zone were collected during July“September 1990 and analyzed for major and minor dissolved constituents, selected stable isotopes, and radioisotopes. These data, supplemental data from an extensive water-quality data base, and data from other previous studies were interpreted to clarify the understanding of the saline-waterzone geochemistry.
Most of the isotope and geochemical data indicate at least two distinct hydrological and geochemical regimes in the saline-water zone of the Edwards aquifer. On the basis of hydrogen and oxygen isotopes and radiocarbon data, the shallower updip regime is predominantly meteoric water that has been recharged probably from the freshwater zone within recent geologic time (less than tens of thousands of years). Also, on the basis of hydrogen and oxygen isotope data, water in the hydrologically stagnant regime (downdip) has been thermally altered in reactions with the carbonate rocks of the zone. The deeper water probably is much older than water in the shallow zone and is nearly stagnant relative to that in the shallow zone.
The geochemical grouping observed in the wellwater data from well samples in the saline-water zone indicates that the zone is hydrologically compartmentalized, in part because of faults that function as barriers to downdip flow of recharge water. These fault barriers also probably impede updip flow. Flow compartmentalization and the resulting disparity in geochemistry between the two regimes indicate that updip movement of substantial amounts of saline water toward the freshwater zone is unlikely.
Estimated in-place temperature of the samples collected indicates an increase with depth and (or) distance from the downdip limit of freshwater. The pH of the samples decreases with increasing distance from the downdip limit of freshwater, but the decrease is caused partly by the increase in temperature. Dissolved major ions and dissolved solids concentrations all indicate a progressive but monotonic increase in salinity from updip to downdip. The alkalinity of the water samples is predominantly bicarbonate because the low molecular weight aliphatic-acid anion concentrations are small relative to the bicarbonate concentrations. The dissolved organic carbon concentrations also are lower than expected for an aquifer with economic amounts of oil and gas hydrocarbons.
Statistical Summary of Water-Quality Data Collected from Selected Wells and Springs in the Edwards Aquifer Near San Antonio, Texas
Description: Compilation and descriptive statistics of water contaminants monitored in the Edwards Aquifer, Balcones Fault Zone, San Antonio Segment, from 1973-1982
Report Number: USGS O-FR 85-182
Location: Edwards Aquifer, Balcones Fault Zone, San Antonio Segment
Summary:Statistical summaries of available water-quality data collected from 90 wells and 3 springs in the Edwards aquifer near San Antonio, Texas, are presented. The statistical summaries provide information on the range in values for each water-quality constituent as well as the mean value, the standard deviation about the mean; and for those constituents with five or more analyses, the percentage of observations in which values were equal to or less than the specified values are presented.
Chemical Analyses of Water from Observation Wells in the Edwards and Associated Limestones, San Antonio Area, Texas, 1966
Description: Chemical analyses of water from 37 wells to define the boundary of the freshwater-saline water interface in the Edwards Aquifer Balcones Fault Zone San Antonio segment in 1966. Note: This report is included for its historical value; results may have been superseded by more recent studies.
Report Number: Bulletin 13
Location: Freshwater/Saline Interface, Edwards Aquifer Balcones Fault Zone San Antonio Segment
Summary:Note: This report is included for its historical value; results may have been superseded by more recent studies.
A program to resample observation wells tapping a zone of transition between water of good quality and saline water in the Edwards and associated limestores was begun in 1959. The chemical analyses of the resampling program are being used to detect possible encroachment of saline water into the fresh-water areas as the head in the aquifer changes. Those analyses compiled through 1965 were published by the Edwards Underground Water District (Garza, 1962b, 1964, 1965, 1966), and this report presents the chemical analyses compiled during 1966. This program is part of a more extensive hydrologic investigation carried on by the U.S. Geological Survey in cooperation with the Edwards Umerground Water District, the Texas Water Development Board, and the city of San Antonio.
Listed in this report are chemical analyses from 37 wells, most of which are sampled twice a year, but some are sampled only once a year because they are little used. The number of wells was reduced in 1966 from 72 to 37, but the original 72 will be sampled again when water levels drop to those levels near and below the recorded lows.
The water samples are analyzed in the laboratory of the U. S. Geological Survey in Austin, Texas, for specific conductance, pH, chloride, sulfate, bicarbonate, and hardness. A more complete analysis has been made for one sample from each well, and these analyses are on file in the offices of the Geological Survey in Austin and San Antonio. Locations of wells and other data pertaining to the resampling program may be found in tables in the report.
Chemical Analyses of Water from Observation Wells in the Edwards and Associated Limestones, San Antonio Area, Texas, 1965
Description: Chemical analyses of water from 72 wells to define the boundary of the freshwater-saline water interface in the Edwards Aquifer Balcones Fault Zone San Antonio segment in 1965. Note: This report is included for its historical value; results may have been superseded by more recent studies.
Report Number: Bulletin 10
Location: Freshwater/Saline Interface, Edwards Aquifer Balcones Fault Zone San Antonio Segment
Summary:This report is included for its historical value; results may have been superseded by more recent studies.
A program to resample observation wells tapping a zone of transition between water of good quality and saline water in the Edwards and associated limestones was begun in 1959. The chemical analyses of the resampling program are being used to detect possible encroachment of saline water into the freshwater areas as the head in the aquifer changes. Those analyses compiled through 1964 were published by the Edwards Underground Water District (Garza, 1962b, 1964, 1965), and this report presents the chemical analyses compiled during 1965. This program is part of a more extensive hydrologic investigation carried on by the U.S. Geological Survey in cooperation with the . Edwards Underground Water District, the Texas Water Commission, and the city of San Antonio.
Listed in this report are chemical analyses from 72 wells most of which are sampled twice a year, put some are sampled only once a year because they are little used. The water samples are analyzed in the laboratory of the U.S. Geological Survey in Austin, Texas, for specific conductance, pH, chloride, sulfate, bicarbonate, and hardness. A more complete analysis has been made for one sample from each well, and these analyses are on file in the offices of the Geological Survey in Austin and San Antionio. Locations of wells and other data pertaining to the resampling program may be found in tables in the report.
Chemical Analyses of Water from Observation Wells in the Edwards and Associated Limestones, San Antonio Area, Texas, 1964
Description: Chemical analyses of water from 80 wells to define the boundary of the freshwater-saline water interface in the Edwards Aquifer Balcones Fault Zone San Antonio segment in 1964. Note: This report is included for its historical value; results may have been superseded by more recent studies.
Report Number: Bulletin 7
Location: Freshwater/Saline Interface, Edwards Aquifer Balcones Fault Zone San Antonio Segment
Summary:Note: This report is included for its historical value; results may have been superseded by more recent studies.
A program to resample observation wells tapping a zone of transition between water of good quality- and saline water in the Edwards and associated limestones was begun in 1959. The chemical analyses of the resampling program are being used to detect possible encroachment
of saline water into the fresh-water areas as the head in the aquifer changes. Those analyses compiled through 1963 were published by the Edwards Underground Water District (Garza, 1962, 1964), and this report presents the chemical analyses compiled during 1964.
This program is part of a more extensive hydrologic investigation carried on by the U.S. Geological Survey in cooperation with the Edwards Underground Water District, the Texas Water Commission, and the city of San Antonio.
Listed in this report are chemical analyses from 80 wells which usually are sampled twice a year, but some of the wells are sampled only once throughout the year because their use is limited.
The water samples were analyzed in the laboratory of the U.S. Geological Survey in Austin, Tex., for specific conductance, pH, chloride, sulfate, bicarbonate, and hardness. A more complete analysis was made for one or the samples from each well, and these analyses are on file in the offices of the Geological Survey in Austin and San Antonio. Locations o£ wells and other data pertaining to the resampling program may be found in tables in the report.
Chemical Analyses of Water from Observation Wells in the Edwards and Associated Limestones, San Antonio Area, Texas, 1963
Description: Chemical analyses of water from 100 wells to define the boundary of the freshwater-saline water interface in the Edwards Aquifer Balcones Fault Zone San Antonio segment in 1963. Note: This report is included for its historical value; results may have been superseded by more recent studies.
Report Number: Bulletin 4
Location: Freshwater/Saline Interface, Edwards Aquifer Balcones Fault Zone San Antonio Segment
Summary:Note: This report is included for its historical value ; results may have been superseded by more recent studies.
Ground water users in the San Antonio area have been concerned about possible encroachment of saline water into the fresh-water-bearing part of the Edwards and associated limestones as the head in the aquifer changes. As a result, the program to resample observation wells tapping the zone of transition between water of good quality and saline water in the Edwards and associated limestones was begun in 1959. Chemical analyses compiled through 1962 were published by the Edwards Underground Water District (Garza, 1962), and this report presents the chemical analyses compiled during 1963. The resampling program is part of a more extensive hydrologic investigation carried on by the U. S. Geological Survey in cooperation with the Edwards Underground Water District, the Texas Water Commission, and the city of San Antonio.
Chemical analyses of water from 100 wells are listed in this report. Most of the wells are sampled twice a year, but some of the wells are not in continuous use and it is not possible to sample them that frequently. About 80 wells are sampled twice a year; the remainder have been placed on standby to be resampled when the wells are in use.
The water samples are analyzed in the laboratory of the U.S. Geological Survey in Austin, Tex., for specific conductance , pH, chloride, sulfate, bicarbonate, and hardness . A more complete analysis has been made for one of the samples from each well, and these analyses are on file in the offices of the Geological Survey in Austin and San Antonio. Locations of wells and other data pertaining to the resampling program may be found in tables in the report.
Chemical Analyses of Water from Observation Wells in the Edwards and Associated Limestones, San Antonio Area, Texas [1959-1962]
Description: Chemical analyses of water from 129 wells to define the boundary of the freshwater-saline water interface in the Edwards Aquifer Balcones Fault Zone San Antonio segment,some data going back to 1959. Note: This report is included for its historical value; results may have been superseded by more recent studies. Last page of file is full-size plate.
Report Number: Bulletin 1
Location: Freshwater/Saline Interface, Edwards Aquifer Balcones Fault Zone San Antonio Segment
Summary:Note: This report is included for its historical value; results may have been superseded by more recent studies.
The city of San Antonio and other water users in the San Antonio area have been concerned about the possibility of the encroachment of saline water into the fresh water-bearing part of the aquifer supplying the area. As a result, a program was begun in 1959 to resample wells tapping the zone of transition between water of good quality and saline water in the Edwards and associated limestones, in order to detect changes in quality of the water as the head in the aquifer changed. This program is part of a more extensive hydrologic investigation being carried on by the U.S. Geological Survey in cooperation with the Edwards Underground Water District, the Texas Water Commission, and the City of San Antonio. As part of this program, about 120 wells are resampled twice a year; the water is analyzed in the laboratory of the Geological Survey in Austin, Tex., for specific conductance, pH, chloride, sulfate, bicarbonate, and hardness. A more complete chemical analysis is made for one of the samples from each well in the program. These more complete analyses are on file in the offices of the Geological Survey in Austin and San Antonio.
Chemical analyses of water from 129 wells are shown in the table in this report. The analyses of samples collected before 1959 for many of the wells are shown also. Some of the wells are no longer in use, but chemical analyses of previous samples from these wells are carried in the records, although future sampling may not be possible. Figure 1 shows the location of the resampled wells and an arbitrary boundary line between water of good quality, containing less than 1,000 parts per million (ppm), and saline water, containing more than 1,000 ppm of dissolved solids (Garza, 1962, p. 38 ).


