Aquifer Conditions
Science & Data Document Library
Science and Data Resources
Records of Ground-Water Recharge, Discharge, Water Levels and Chemical Quality of Water for the Edwards Aquifer in the San Antonio Area, Texas, 1934-79.
Description: Compilation of Hydrologic Data for the Edwards Aquifer, San Antonio Area, Texas, 1934-79. Annual hydrologic report issued by the Edwards Underground Water District.
Report Number: Bulletin 39
Location: Edwards Aquifer - San Antonio Area
Summary:The average annual ground-water recharge to the Edwards aquifer in the San Antonio area, Texas, from 1934 through 1979, was 598,800 acre-feet. The recharge in 1979 was 1,117,800 acre-feet, which was the fifth highest estimated recharge since 1934. A maximum annual recharge of 1,711,200 acre- feet occurred in 1958, and a minimum annual recharge of 43,700 acre-feet occurred in 1956.
The estimated annual discharge by wells and springs in 1979 was 914,500 acre-feet . A maximum annual discharge of 960,900 acre-feet occurred in 1977, and a minimum annual discharge of 388,800 acre-feet occurred in 1955.
During 1979, water levels in wells in the Edwards aquifer fluctuated near record highs; consequently, the volume of ground water in storage in the aquifer also was near the record high.
Analyses of water samples from 77 wells and 3 springs show no evidence of significant degradation of water quality in the Edwards aquifer, and the data show no trend of degradation in water quality.
Records of Ground-Water Recharge, Discharge, Water Levels and Chemical Quality of Water for the Edwards Aquifer in the San Antonio Area, Texas, 1934-78
Description: Records of Ground-water Recharge and Discharge, 1934-78; Water Levels, 1975-78; and Chemical Quality of Water, 1977-78, for the Edwards Aquifer in the San Antonio Area, Texas. Annual hydrologic report issued by the Edwards Underground Water District.
Report Number: Bulletin 38
Location: Edwards Aquifer - San Antonio Area
Summary:The average -annual ground- water recharge to the Edwards aquifer in the San Antonio area, Texas, from 1934 through 1978 was 587,200 acre- feet. The recharge in 1978 was 502,500 acre-feet, ending a trend of above average recharge that began i n 1968. A maximum annual recharge of 1,711,200 acre- feet occurred in 1958, and a minimum annual recharge of 43,700 acre-feet occurred in 1956.
A maximum annual discharge of 960,900 acre- feet occurred in 1977, and a minimum annual discharge of 388,800 acre- feet occurred in 1955. The maximum annual discharge by wells was 431,800 acre- feet in 1978, which is a record high for the 1934-78 period.
Although water levels in wells in the Edwards aquifer showed a general decline in 1978, the volume of ground water in storage in the aquifer was above average.
Analyses of water samples from 72 wells and 3 springs show no evidence of significant degradation of water quality in the Edwards aquifer, and the data show no trend of degradation in water quality.
Use of landsat thematic mapper data to identify crop types and estimate irrigated acreage, Uvalde and Medina Counties, Texas, 1991
Description: Using the landsat thematic mapper to estimate total irrigated acreage and acre-feet of irrigation water for Uvalde and Medina Counties in 1991
Report Number: USGS WRIP 93-4233
Location: Uvalde County, Medina County
Summary:Landsat Thematic Mapper (TM) data were used to estimate that about 51,000 acres of crops were irrigated with water pumped from the Edwards aquifer in Uvalde and Medina Counties, Texas in 1991. Bands 2, 3, 4, and 5 from a TM image for August 10, 1991, were classified using the maximum-likelihood, unsupervised-classification procedure to identify the areas of crops irrigated in the two counties. Detailed vegetation distribution maps of two calibration sites in the study area, and boundaries of the areas probably irrigated in 1991, were used to interpret the results and to separate probable irrigated areas by county from the rest of the image.
Areas calculated for irrigated crops were 31,000 acres for Uvalde County, about 35 percent less than the area calculated using Landsat multispectral scanner (MSS) data in 1989, and 20,000 acres for Medina County, about 13 percent less than in 1989, a total decrease of about 28 percent for the two counties. Quantities of water pumped from the Edwards aquifer to irrigate crops in 1991 were estimated as 65,000 acre-feet for Uvalde County and 18,000 acre-feet for Medina County, a total decrease of about 56 percent from the value calculated using crop acreages from MSS data for 1989. Differences were attributed primarily to greater precipitation in 1991 than in 1989, resulting in smaller irrigation water requirements and less supplemental irrigation in 1991. Differences between results from 1989 and 1991, and between results from Uvalde and Medina Counties in 1991, were attributed primarily to greater precipitation in 1991, particularly in Medina County.
The total number of acres of irrigated crops estimated using Landsat TM data was about 9 percent lower in Uvalde County and about 13 percent lower in Medina County than the number of acres calculated from data reported by the U.S. Department of Agriculture, Agricultural Stabilization and Conservation Service (ASCS). The total quantity of water pumped from the Edwards aquifer for irrigation in the two counties in 1991, about 83,000 acre-feet, was about 5 percent greater than the quantity calculated from data reported by the ASCS.
2017 Tech Brief RockWare – Jim Reed

The EAA Recharge Program Technical Briefing to the EAA Board of Directors

How-San-Antonio-Became-a-National-Water-Conservation-Model

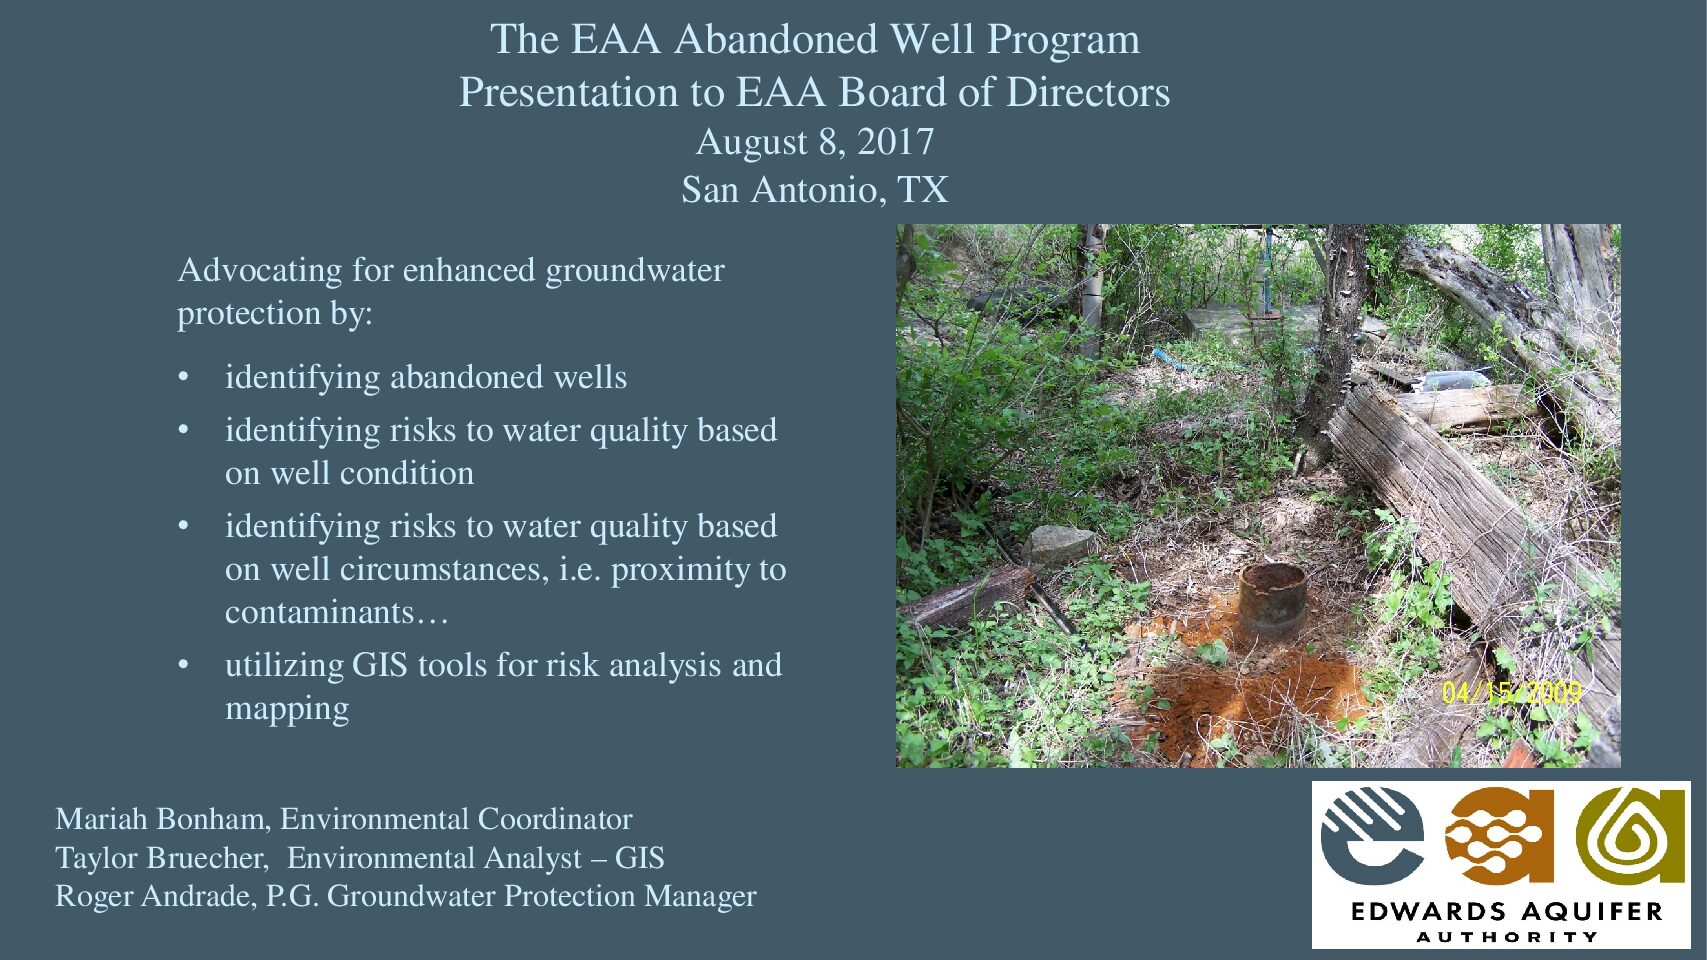
The EAA Abandoned Well Program Presentation to EAA Board of Directors
Re-evaluation of airborne Geophysical Surveys in the Edwards and Trinity Aquifers
Re-conceptualizing the EAA Recharge Program for Optimizing and Protecting the Beneficial Use of the Edwards Aquifer
Updates to the MODFLOW Groundwater Model of the San Antonio Segment of the Edwards Aquifer
Interlocal Cooperative Contract with New Braunfels Utilities for Development of Aquifer Storage and Recovery Overview of Project Monitoring
2023 Water Quality Summary
2022 Precipitation In The Edwards Aquifer Region
2022 Groundwater Discharge & Usage Report
2021 Groundwater Recharge Report