
 Aquifer Conditions
Science & Data Document Library
Science and Data Resources
Ground-Water Discharge from the Edwards and Associated Limestones, San Antonio Area, Texas, 1963
Description: Annual report for 1963 on discharge from the Edwards Aquifer issued by the Edwards Underground Water District
Report Number: Bulletin 5
Location: Edwards Aquifer - San Antonio Area
Summary:Records of the ground-water discharge from the Edwards and associated limestones in the San Antonio area are collected as part of the overall hydrologic investigation of the U. S. Geological Survey in cooperation with the Edwards Underground Water District, the Texas Water Commission, and the city of San Antonio. This investigation has been continued for many years and has resulted in several geologic and hydrologic reports, some of which are listed in the references. This report is one of three basic-data reports published yearly by the Edwards Underground Water District .
The table included in this report represents the discharge from the Edwards and associated limestones during 1963 in each county of the area by use. The spring discharge was from San Marcos Springs in Hays County, Comal Springs in Comal County, San Antonio and San Pedro Springs in Bexar County, and the Leona River Springs in Uvalde County . Most of the discharge for municipal and military use was from wells in Bexar County.
More than 38,000 acres was irrigated from wells in Uvalde, Medina, and Bexar Counties in 1963. Most of the remaining well discharge, (industry, domestic, stock, and miscellaneous) was in Bexar County. Nearly 54 percent of the total discharge from the Edwards and associated limestones during 1963 came from wells, and almost 80 percent of the total discharge from wells was in Bexar County. The well discharge in 1963 was slightly more than in 1962 because of small increases for municipal and irrigation uses. However, springflow in 1963 decreased enough to make the total discharge nearly 73,000 acre-feet less than in 1962.
Appendix B A Report Investigating Impacts of Aquifer Pumping Limits on Flow of Comal Springs and San Marcos Springs
Description: Use of GWSIM-IV model to determine effects of various pumpage reductions on springflow at Comal and San Marcos Springs
Location: Edwards Aquifer, Balcones Fault Zone, San Antonio Segment, Comal Springs, San Marcos Springs
Summary:LBG-Guyton Associates was contracted by Hicks Environmental to do a series of model runs with the Edwards Aquifer model (in GWSIM-IV) to determine the impact on Comal and San Marcos springflows of various pumpage reduction strategies. This investigation is part of the Habitat Conservation Plan (HCP) study being conducted for the Edwards Aquifer Authority {EAA). This work was conducted under project number 99227.
Several different scenarios were modeled to determine the impact of reductions of different types of pumpage on springflows. The scenarios modeled included:
- Equal pumpage reductions across the model area
- Reduction of irrigation pumpage only
- Reduction of municipal and industrial pumpage only
- Reduction of irrigation pumpage in Medina County only
- Reduction of irrigation pumpage in Uvalde County only
This report details the methodology used to make the model simulations, the assumptions used, and gives the results of the simulations and a discussion on the meaning of these results.
Streamflow Conditions in the Guadalupe River Basin, South-Central Texas, Water Years 1987-2006-An Assessment of Streamflow Gains and Losses and Relative Contribution of Major Springs to Streamflow
Description: Use of streamflow and springflow data to estimate contribution of springflow from Comal, San Marcos and Hueco Springs to streamflow in the Guadalupe River Basin
Report Number: USGS SIR 2008-5165
Location: Edwards Aquifer, Balcones Fault Zone, San Antonio Segment, Guadalupe River Basin
Summary:The U.S. Geological Survey, in cooperation with the Edwards Aquifer Authority, assessed available streamflow
data in the Guadalupe River Basin to determine streamflow gains and losses and the relative contribution of flow from major springs”Comal Springs, San Marcos Springs, and Hueco Springs”to streamflow in reaches of the Guadalupe River and its tributaries. The assessment is based primarily on long-term (1987“2006) and short-term (January 1999, August 1999, August 2000, and August 2006) streamflow conditions. For each analysis period, the ratio of flow from the major springs (measured at the spring source) to the sum of inflows (measured at the source of inflow to the river system) is computed for reaches of the Comal River and San Marcos River that include springflows from major springs, and for Guadalupe River reaches downstream from Canyon Dam. The ratio
of springflow to the sum of inflows to the reach is an estimate of the contribution of flows from major springs to streamflow.
For 1987“2006, the ratio of springflow from the major springs to the sum of inflows for the most upstream reach that includes inflow from all three major springs, Guadalupe River”above Comal River to Gonzales, is 27 percent. At the lowermost downstream reach, Guadalupe River”Bloomington to the San Antonio River, the percentage of the sum of inflows attributed to springflow is 18 percent. At that lowermost reach, the ratio of Canyon Lake releases to the sum of inflows was 20 percent.
For the short-term periods August 2000 and August 2006 (periods of relatively low flow), springflow in the reach Guadalupe River”above Comal River to Gonzales accounted for 77 and 78 percent, respectively, of the sum of inflows in that reach. At the lowermost reach Guadalupe River”Bloomington to San Antonio River, springflow was 52 and 53 percent of the sum of inflows, respectively, during August 2000 and August 2006 (compared with 18 percent during 1987“2006); and during August 2000 and August 2006, the ratios of Canyon Lake releases to the sum of inflows were less than 10 percent (compared with 20 percent during 1987“2006).
Water Quality Trends Analysis of the San Antonio Segment, Balcones Fault Zone Edwards Aquifer, Texas

Description: Collection and analysis of thousands of groundwater, surface water, and spring water samples to evaluate water quality in the San Antonio segment of the Balcones Fault Zone Edwards Aquifer of south central Texas.
Location: Edwards Aquifer, San Antonio Segment, Balcones Fault Zone
Summary:The Edwards Aquifer Authority (EAA) and other public agencies have collected and analyzed thousands of groundwater, surface water, and spring water samples to evaluate water quality in the San Antonio segment of the Balcones Fault Zone Edwards Aquifer of south central Texas. In July 2009, EAA staff prepared a report evaluating water quality data collected through August 2006. This update includes water quality data collected through June 2013. Like the original report, the purpose of this report is to examine this body of water quality data to characterize historical water quality, existing conditions, and water quality trends, as well as to identify specific constituents of concern (COCs) within the aquifer. Emphasis is placed on evaluating the presence of COCs that may have resulted from human activity in the study area. Water quality data were collected by the EAA, its predecessor agency, the Edwards Underground Water District (EUWD); the United States Geological Survey (USGS); and the Texas Water Development Board (TWDB) since 1913. More than 13,000 samples totaling more than 700,000 individual parameters were compiled for this report. Analytical data evaluated for the update of this report since 2006 has not changed the conclusions of the original report. The results are characterized by infrequent detections of potential contaminants in groundwater and surface water from multiple sources. Vulnerability of the aquifer to contamination has been demonstrated by the detection of parameters that do not occur naturally in the aquifer. The organic compounds were detected mainly in urban areas, whereas nitrate was detected throughout the aquifer. Despite the additional data, they are insufficient to determine whether concentrations are increasing or decreasing. Based on all of the historical analyses through June 2013, concentrations of 28 parameters exceeded protective concentration levels (PCLs) in one or more samples, which includes one additional parameter (nitrite) from the post-2006 analyses. The parameters were selected as COCs because their concentrations exceeded the assimilative capacity of the aquifer, which is the capacity of the aquifer to attenuate the concentrations of contaminants to acceptable levels before they reach a well or spring.
Universal Passive Samplers and the Aliasing Problem in Groundwater Sampling
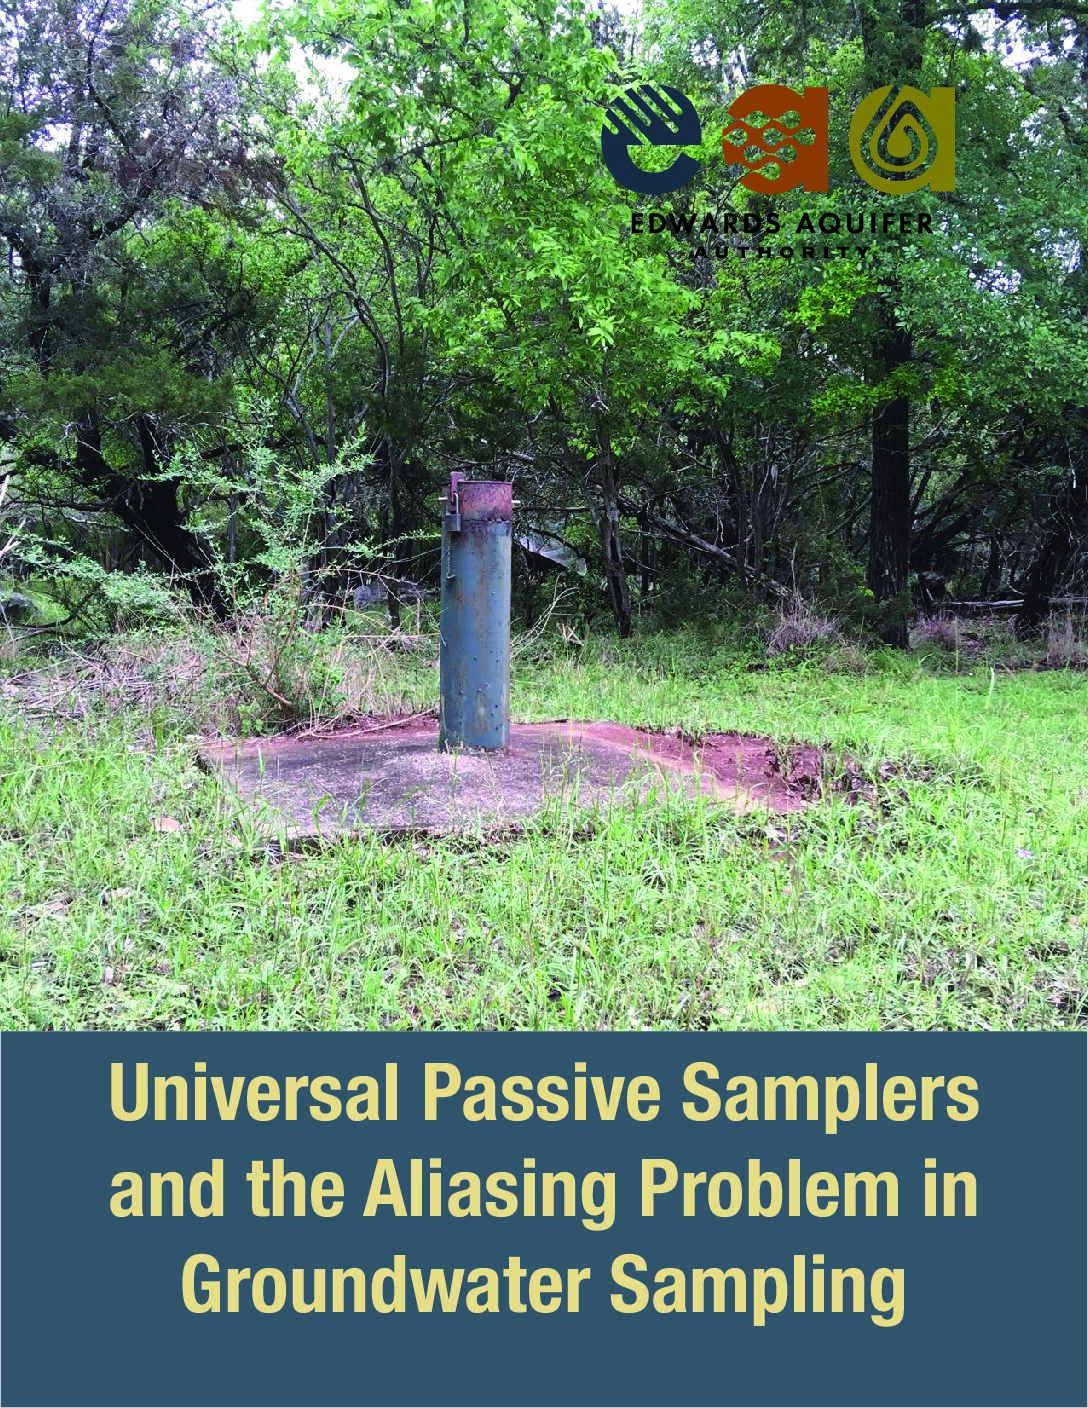
Description: AY-68-29-418 (Rio Seco) was selected for this study because it is within the Recharge Zone of the Edwards Aquifer surrounded by urban development, and water samples contain consistent PCE concentrations. AY-68-29-418 was sampled eight times to determine the correlation between PCE concentrations from universal passive samplers and water quality grab samples. EAA field staff exchanged the universal passive samplers every 48 hours, one universal passive sampler for one-hour exposure time, and two universal passive samplers for ten days exposure time. During each retrieval of universal passive samplers, EAA field staff also obtained a grab sample.
Location: San Antonio, Rio Seco, Edwards Aquifer
Summary:The Edwards Aquifer Authority (EAA) evaluated the role of passive sampling devices for improving the collection of representative samples for its water quality monitoring program. The purpose of this study was to investigate the use of universal passive samplers to overcome aliasing which reflects the inability of grab samples to capture a complete record of groundwater contaminant concentrations. Monitoring well (AY-68-29-418, Rio Seco) was sampled with universal passive samplers with exposure times of one hour, 48 hours, and ten days. Grab samples were collected after each exposure period. Tetrachloroethene (PCE) was detected in all of the universal passive samples; total petroleum hydrocarbon (TPH) was detected in 80% of the samples; benzene, toluene, ethylbenzene, and xylenes (BTEX) was detected in 33% of the samples; toluene was detected in 26% of the samples; chloroform was detected in 20% of the samples; and benzene was detected in 7% of the samples. Only PCE was detected in the grab samples. These findings indicated that universal passive samplers can detect contaminants at lower concentrations than grab samples, and the PCE concentrations were directly proportional to exposure time rather than the maximum concentration in the groundwater. Consequently, universal passive samplers only partially overcome aliasing by indicating the presence or absence of contaminants in groundwater.
Blasting Effects on Engineered Structures Appendices H, I ,J
Description: Appendices H, I, J to main companion report
Report Number: 92-01
Location: Edwards Aquifer, Balcones Fault Zone, San Antonio Segment, Recharge Zone, Bexar County
Summary:Appendices H, I, J to main companion report
Blasting Effects on Engineered Structures Appendices A-G
Description: Appendices A-G to main companion report.
Report Number: 92-01
Location: Edwards Aquifer, Balcones Fault Zone, San Antonio Segment, Recharge Zone, Bexar County
Summary:Appendices A-G to main companion report.
Blasting Effects on Engineered Structures
Description: Report of field study on effects of blasting charges on structure and function of nearby pipes, wells, and tanks. See accompanying appendices.
Report Number: 92-01
Location: Edwards Aquifer, Balcones Fault Zone, San Antonio Segment, Recharge Zone, Bexar County
Summary:The investigation of the effects of blasting was commissioned by the Edwards Underground Water District (EUWD) to determine how blasting degrades the integrity of underground structures and what criteria might be effective to limit facility degradation. The study successfully achieved both
objectives, and the major findings are as follows:
(1) None of the structure types investigated in the field (wells, pipes and tanks) suffered damage causing loss of their contents or loss of function when production charges were detonated at distance greater or equal to 10 feet. All of the structures in the study were in good condition and installed according to city and state specifications. More conservative criteria should be applied to structures and systems that have not been constructed according to specifications and/or have become more fragile with age. Also, the total size of the blast and the delay sequence must be considered.
(2) Well-behaved relationships between the amplitude of blast response at a given location and the size of the energy source (velocity response ratio, VRR) were obtained. These relationships indicate that the vibration response to production blasting at selected locations may be predicted with reasonable accuracy from the measured site response to small (calibration) blasts.
(3) Variations of blast response amplitude with depth (normalized velocity response, NVR) for the target structures were also well behaved. In general, amplitude decreases with depth. When the charge is detonated close to the structure, the amplitude may be relatively constant with depth, or may increase with depth for large, close events. The longitudinal (radial) component of motion is most likely to display the latter behavior, probably due to improved energy transmission in saturated ground.
(4) The relationships between source energy and response amplitude, and the relationships between amplitude and depth may be combined in a response prediction procedure. First the site response to a small charge (e.g. 1/2 lb. of dynamite) is measured at points of interest. Next the ground surface response to a production blast is determined from the low-energy response and the energy/amplitude relationship, VRR. Finally the subsurface response in and around the structure is predicted from the surface response and the relationship between amplitude and depth, NVR. Details of the development and application of the procedure are given in section 7 of the report.
The prediction techniques developed in the study show promise for application to vibration control during production blasting. Application of the method in construction will provide an opportunity to collect a reservoir of data which can be used to improve the accuracy and precision of site response predictions. Reducing uncertainty in blast operations will help the excavation contractor to complete his job more safely and efficiently, and will reduce the risk of aquifer contamination by limiting damage to underground structures.
The investigators acknowledge the generous support of the Edwards Underground Water District for the work completed under this contract, and look forward to providing future assistance to the District in the development of solutions to related technical problems.
Edwards Underground Water District, San Marcos Testing, Hays County, Texas
Description: Archaeological test site at Spring Lake, San Marcos, TX excavated prior to more extensive water monitoring activity.
Location: Spring Lake, San Marcos, Hays County, TX
Summary:A 1 m x 1 m test unit was excavated on the southern edge of Spring Lake in San Marcos, Texas at the location of a well site to be drilled by the Edwards Underground Water District. Very limited cultural resources were located in this investigation and thus no additional cultural studies are recommended.
Helotes Mulch Fire 2006 Tracing Groundwater Flow Using Natural Fluorescent Materials
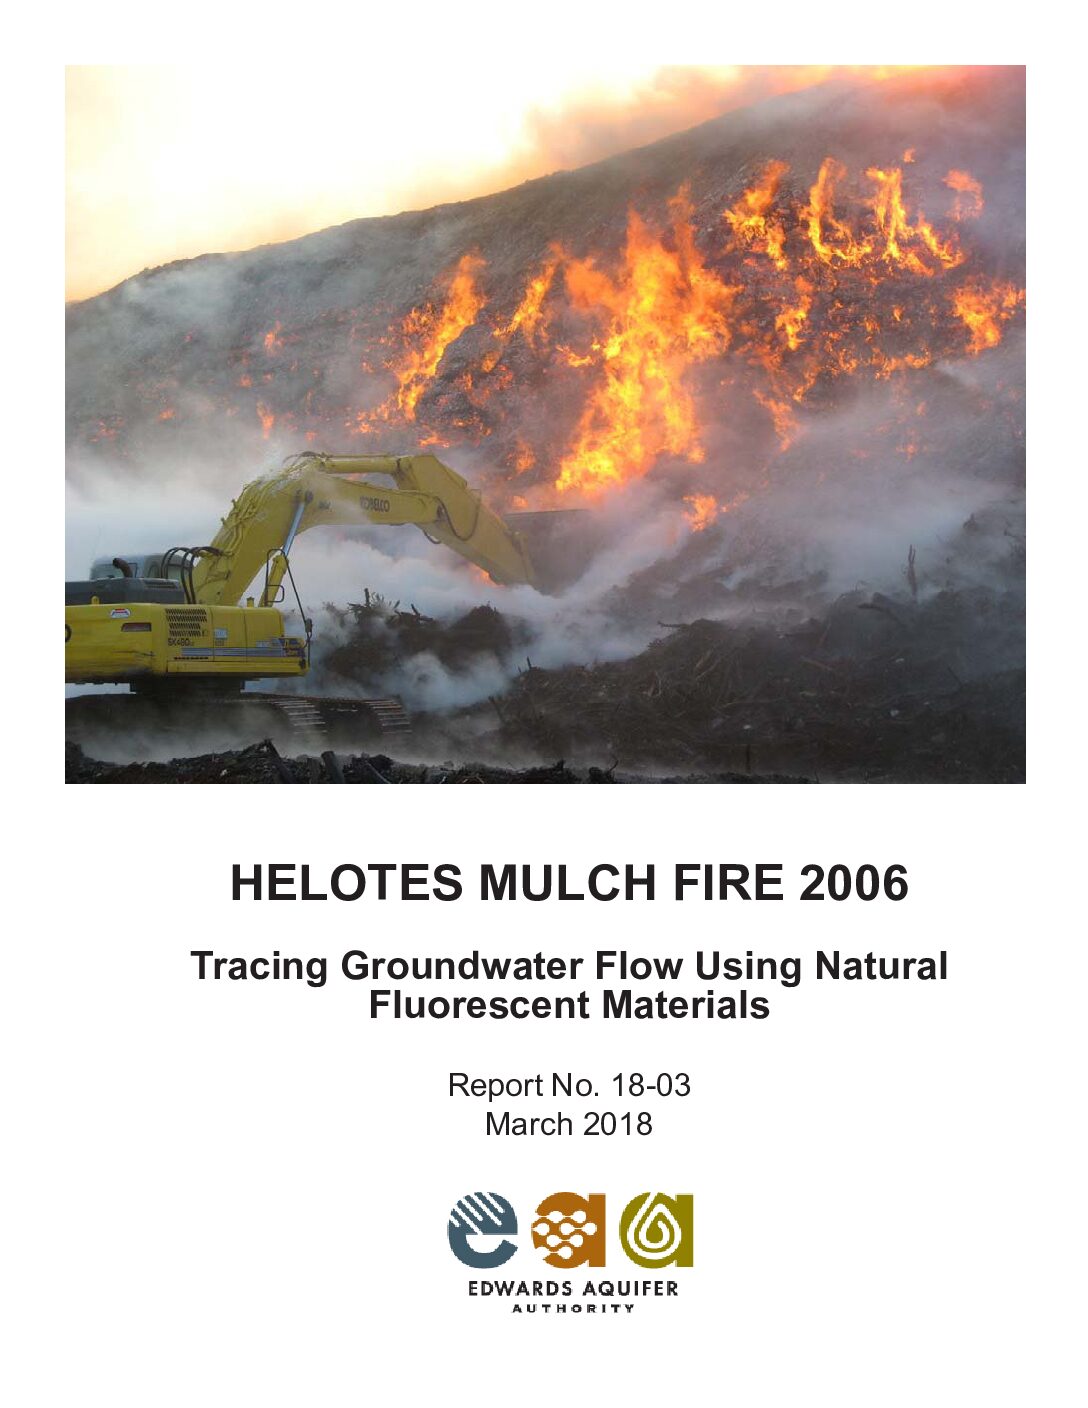
Description: With approximately 21 million gallons of water (LFCI, 2011) having been trained on the debris pile, the Helotes mulch fire effectively became a tracer test of huge proportions. It provided an opportunity for us to study the karst-related flow characteristics of the Edwards and Trinity aquifers. The fire-fighting water mobilized naturally fluorescing woody material and products of combustion that could be measured in groundwater using conventional fluorescence spectroscopy. Results revealed many of the characteristics of karst in both aquifers.
Report Number: 18-03
Location: Helotes, Edwards Aquifer, Trinity Aquifer, Helotes Creek
Summary:On the evening of December 25, 2006, an 80-foot high debris pile located in Helotes, Texas, caught fire as shown in Figure 1. The debris consisted of brush, trees, and other materials from area developers that had been converted to mulch over several years and stored until it reached approximately 400 feet (ft) long and 225 ft wide. After applying millions of gallons of water onto the pile, the fire was finally extinguished on March 28, 2007.
Re-Conceptualizing the Edwards Aquifer Authority Recharge Program: Staff Recommendations to Optimize and Protect the Edwards Aquifer
Description: Recharge is defined in the EAA Act as: Increasing the supply of water to the aquifer by naturally occurring channels or artificial means. Based on this definition, the EAA recharge program previously consisted of four recharge dams initially sponsored by the EUWD and Medina County Commissioners Court until calendar year 2004, when participation in the regional Precipitation Enhancement Program (PEP) was added to the program.
Location: Edwards Aquifer - San Antonio Area
Summary:Since the 1970s, the Edwards Aquifer Authority (EAA) and its predecessor agency, the Edwards Underground Water District (EUWD), have operated and maintained four recharge dams located on the recharge zone of the Edwards Aquifer (Aquifer) in Medina County. These structures were constructed by the EUWD on private properties through negotiated easement agreements with landowners within the Nueces River and San Antonio River basins for the purpose of artificially enhancing natural occurring recharge to the Aquifer. The Edwards Aquifer Authority Act (Act) further recognized the aquifer’s recharge capability by granting the EAA the authority to enter into cooperative contracts with political subdivisions of the State of Texas for artificial recharge and to own, finance, and construct recharge dams. To date, however, there have not been any new dams constructed.
Over time, with the advent of new technologies and improved understanding of the hydraulic nature of the Aquifer, the EAA Recharge Program has evolved beyond the concept of enhanced recharge (or dams) and has developed into a more comprehensive initiative focused on enhancing the available yield of and protecting the water quality in the Aquifer. As a result, today, enhanced recharge is only one of a multitude of tools available to the EAA in its mission to optimize the yield and protect the long-term sustainability of the Aquifer for its beneficial use.
Accordingly, this report is presented to communicate the updated scope and priorities of the EAA Recharge Program as they have evolved over time. Included is background information on the aquifer and its geologic and hydraulic attributes, summaries of various regional supply strategies and, finally, staff recommendations for the program’s future direction. Background information used to develop this document is derived from previous EAA staff presentations to the Board of Directors (two presented as Technical Briefings and three as reports to the Aquifer Management Planning Committee), which are summarized in the Appendix and available as electronic or hardy copy on request.
Recharge is defined in the EAA Act as: Increasing the supply of water to the aquifer by naturally occurring channels or artificial means. Based on this definition, the EAA recharge program previously consisted of four recharge dams initially sponsored by the EUWD and Medina County Commissioners Court until the calendar year 2004, when participation in the regional Precipitation Enhancement Program (PEP) was added to the program.
As shown in Figure 2, the EAA Recharge Program has evolved to include a comprehensive set of aquifer optimization and protection strategies. Protection strategies include enforcing EAA Act regulations, monitoring Edwards Aquifer Protection Programs (easements and stormwater basins) sponsoring the EA SRC, canvassing and assessing wells, and conducting water quality research. Management strategies resulting from the EAA Act, such as the EAHCP and Edwards transfers make the use of existing water resources more efficient. Storage strategies, such as the SAWS ASR, are an effective tool to supplement pumping demands during critical periods. These non-recharge optimization strategies combined with protective measures that address equally important water quality components add to the long-term sustainability of the aquifer system. In Figures 7a-b, the benefits of current aquifer optimization and protection strategies are summarized and quantified, where possible.
In addition to listed existing activities, EAA staff collaborates with regional entities and reviews the technical and legal merit of proposed projects to increase the firm yield of the aquifer. In the future, part of that collaboration could include hosting a workshop to bring regional planners, managers, purveyors, and scientists together to share thoughts regarding new optimization strategies. Although, hosting this type of event would require staff resources and funding to accomplish, it may provide a valuable forum for sharing optimization strategies between interested parties.
Note: EAA resources required to review project proposals can be a significant investment due to the complexity of issues and length of time involved. Based on past performance, staff believe that resources are adequate to continue this process without impacting our management fee. This could change, however, if the number or complexity of proposed projects increase.
Field and Laboratory Tests of Passive Sampling Techniques
Description: One of the objectives of the study was to compare the results between the five urban wells and the two rural wells. Only one rural sample contained PCE, and all the other detections were fuel-related compounds, in contrast to the frequent detections of PCE in the urban wells.
Location: Edwards Aquifer, Bexar County, Hays County, Medina County, Uvalde County
Summary:Between 2007 and 2015, the Edwards Aquifer Authority (EAA) evaluated passive sampling devices for improving the collection of representative samples for its water quality monitoring program. Passive sampling techniques involve the placement of a passive sampling devices (PSD) in water over a prescribed time. While submerged, inorganic constituents and organic compounds diffuse through a porous membrane or sorb onto compatible media. PSDs are then recovered and analyzed for target analytes. Passive samplers offer the ability to monitor for selected analytes over a longer, continuous period compared to grab samples of water. Since PSDs concentrate sorbed compounds, they may indicate the presence of analytes that are not detectable by grab samples. Consequently, PSDs complement grab samples by offering detections at concentrations that are lower than the detection limits of compounds in the grab samples. The EAA aims to systematically evaluate passive sampling technologies to determine if PSDs may improve EAA's water quality sampling program, especially with respect to detecting transient chemicals or the presence of chemicals below laboratory detection limits for compounds dissolved in water.
Appendix C of Edwards Aquifer Authority Hydrologic Data Report for 2014
Description: Appendix C of Edwards Aquifer Authority Hydrologic Data Report for 2014 Year 2014 Water Quality Data
Report Number: Appendix C
Location: Edwards Aquifer - San Antonio Area
Summary:Appendix C of Edwards Aquifer Authority Hydrologic Data Report for 2014
Year 2014 Water Quality Data
Edwards Aquifer Authority Hydrologic Data Report for 2015 Groundwater
Description: Annual report for 2015 on recharge, discharge, water levels and water quality in the Edwards Aquifer San Antonio Region
Report Number: 15-01
Location: Edwards Aquifer - San Antonio Area
Summary:This report presents results of the Edwards Aquifer Authority's (EAA's) Edwards Aquifer Data Collection Program for calendar year 2014. The report also provides a summary of events that were considered significant and that may have affected the Edwards Aquifer during the year. During 2015, the EAA collected a wide variety of Edwards Aquifer related data, including
*Groundwater level data;
*Precipitation measurement data;
*Groundwater recharge data;
*Groundwater discharge and usage data; and
*Water quality data from groundwater, surface water, and springs.
Records of Ground-Water Recharge, Discharge, Water Levels and Chemical Quality of Water for the Edwards Aquifer in the San Antonio Area, Texas, 1934-82.
Description: Compilation of Hydrologic Data for the Edwards Aquifer, San Antonio Area, Texas, 1982, with 1934-82 Summary. Annual hydrologic report issued by the Edwards Underground Water District.
Report Number: Bulletin 42
Location: Edwards Aquifer - San Antonio Area
Summary:The average annual ground-water recharge to the Edwards aquifer in the San Antonio area, Texas, from 1934 through 1982, was 608,400 acre-feet. The recharge in 1982 was 417,700 acre-feet. A maximum annual recharge of 1,711,200 acre-feet occurred in 1958, and a minimum annual recharge of 43,700 acre-feet occurred in 1956.
The calculated annual discharge by wells and springs in 1982 was 786,400 acre-feet. Annual discharge by wells and springs ranged from a maximum of 960,900 acre-feet in 1977 to a minimum of 388,800 acre-feet in 1955. The annual discharge by wells was 453,100 acre-feet in 1982, which is the second highest discharge for the 1934-82 period of record.
Although water levels in many of the wells in the Edwards aquifer fluctuated near the midpoint between record high and low levels during the summer of 1982, the volume of ground water in storage in the aquifer was above average for most of the year.
Analyses of water samples from 56 wells and 3 springs show that the water is of a significantly better quality than the level established for public water systems. However, trace concentrations of organic compounds were detected in some of the analyses.


