
 Aquifer Conditions
Science & Data Document Library
Science and Data Resources
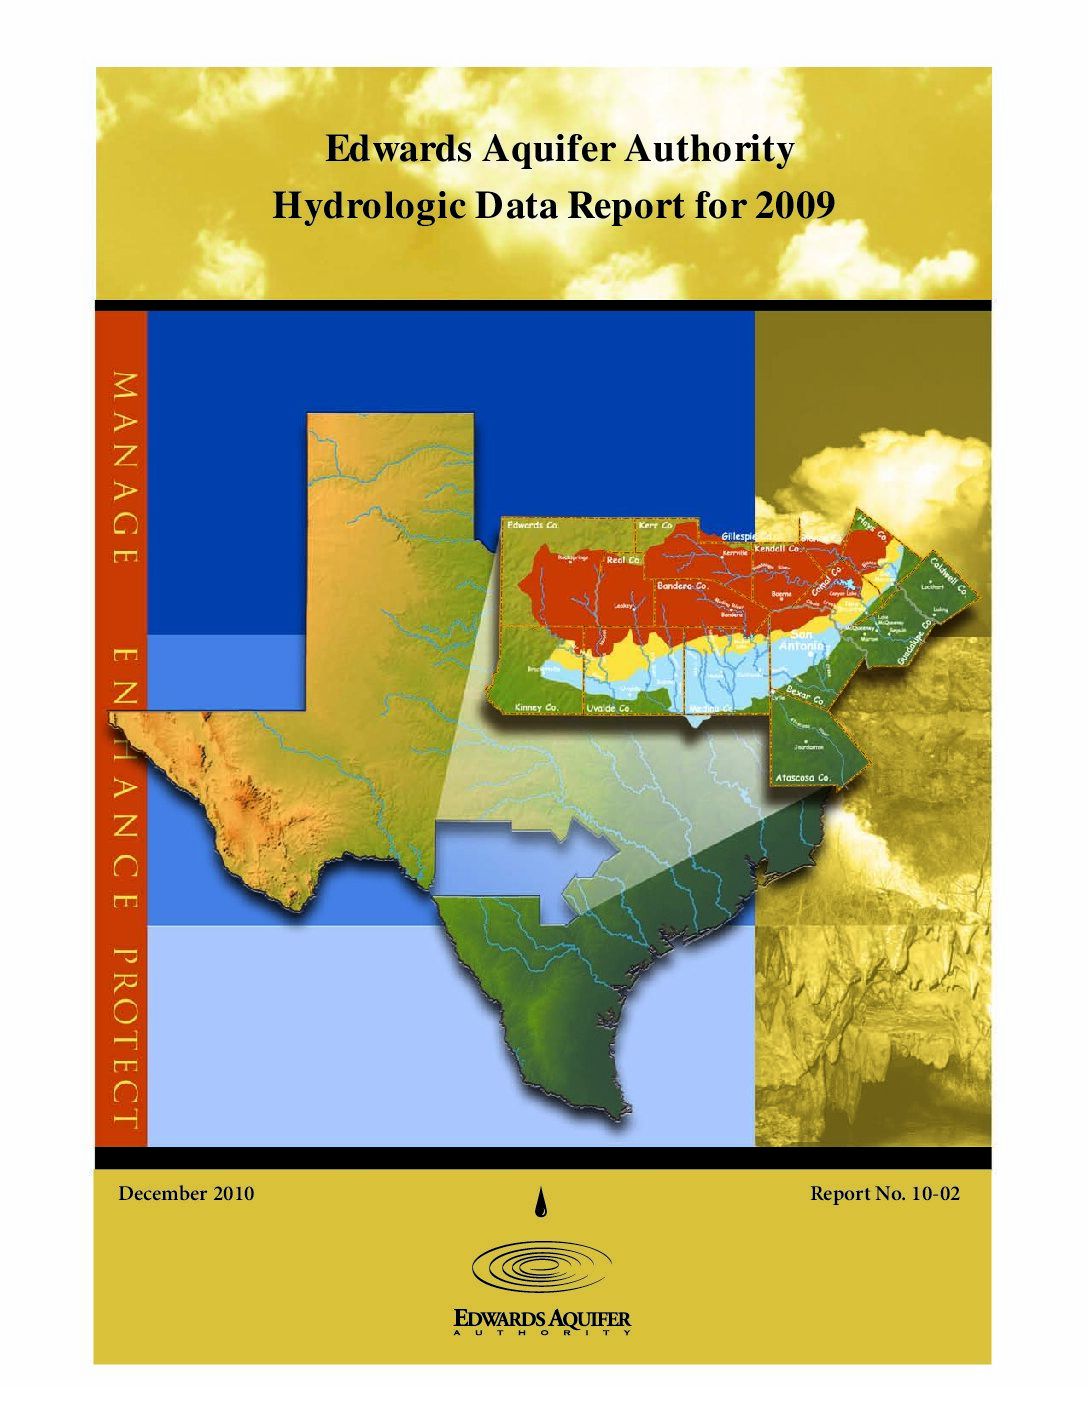
Edwards Aquifer Authority Hydrologic Data Report for 2010

Description: Annual report for 2010 on recharge, discharge, water levels and water quality in the Edwards Aquifer San Antonio Region
Report Number: 1-Nov
Location: Edwards Aquifer - San Antonio Area
Summary:(Excerpted from the report Summary)
This report presents results of the Edwards Aquifer Authority (EAA) Hydrologic Data Collection Program for calendar year 2010.
Water levels at the Bexar County index well (J-17) fluctuated with rainfall events during 2010 but were above the historical average for most of the year.Other wells in the region were generally above their respective mean levels, with the exception of the Uvalde County index well (J-27), which was below the mean. Annual precipitation in the Edwards Aquifer region was above the mean in 2010, with the exception of the precipitation measured by the gauges located in Uvalde and Hondo.Total estimated recharge to the Edwards Aquifer in 2010 was well above the median.In calendar year 2010, groundwater discharge from the Edwards Aquifer through wells and springs totaled 862,633 acre-feet. This amount is above the median total discharge of 705,600 acre-feet for the period of record (1934“2010).
Water quality analytical results indicated the presence of bacteria counts as high as 530 CFU/100 mL for fecal streptococcus and 230 CFU/ 100 mL for fecal coliform in wells sampled under the routine sampling program. Bacteria detections in wells for 2010 were more frequent than for calendar year 2009, probably because of more abundant rainfall and runoff than occurred in the previous calendar year. Bacteria results from springs and streams were frequently positive but not elevated above the range typically seen.
Regulated metals were not detected above a regulatory standard, although iron was detected above the secondary standard in wells and manganese was detected above the secondary standard in surface waters. Nitrate-nitrite as nitrogen was detected at elevated levels in wells and streams, with one well sample exceeding the regulatory limit for drinking water of 10 mg/L. Low concentrations of organic compounds (below drinking water standards) were detected in wells, springs, and streams. Some of these detections were suspectedto be from post-sample-collection contamination. However, notable detections include tetrachloroethane and toluene in wells and benzene, 2,4-D, pyridine, and monocrotophos in spring samples.
Detections of the organic compounds mentioned above are a concern and warrant continued monitoring. The EAA's aquiferwide, water quality sampling program will continue to monitor wells, streams, and springs for indications of water quality degradation throughout the region. Focused investigations in areas with water quality degradation will be initiated as needed.
The EAA responded to three significant sanitary sewer overflows that occurred in August of 2010. The overflows resulted in the release of raw sewage to the surface at three locations in the north and northwest parts of Bexar County.Only one of the wells sampled following these overflow appeared to be directly impacted. The potentially impacted well is located in the area of the August 20 event and is not an Edwards Aquifer well.
A Lumped Parameter Model for the Edwards Aquifer
Description: Computer modeling of the San Antonio region of the Edwards Aquifer using a nonlinear optimization algorithm with a Kalman filter
Report Number: TWRI Technical Report No 163
Location: Edwards Aquifer - San Antonio Area
Summary:A lumped parameter model has been developed to simulate monthly water levels and spring flows in the Edwards Aquifer. It is less complex and easier to use than the existing complex finite difference models for the Edwards Aquifer. The lumped parameter model was formulated using a discrete, nonlinear, nonstationary system based on control theory. The physical system of the Edwards Aquifer is conceptualized as a series of connected rock filled tanks representing major drainage basins of the aquifer. The model incorporates recharge functions derived from flow loss analysis of the drainage basins above and within the recharge area.
The recharge functions estimate monthly recharge and allow for the interaction between groundwater and surface water for each drainage basin. Pumpage distribution coefficients were derived for each drainage basin to estimate monthly pumpage values. Monthly stream gage and aquifer water level data were used for calibrating and verifying the model. Model parameters were obtained with the aid of a nonlinear optimization algorithm. A Kalman filter was used to improve simulation results. The lumped parameter model proved to be very efficient in simulating 189 monthly iterations of water levels for nine drainage basins in less than four minutes on a 68040 based microcomputer. The model should prove useful for assessing pumpage regulations necessary to maintain springflows under historic drought conditions and for exploring management alternatives for the Edwards Aquifer.
Future plans and research consist of re-coding the model as a spreadsheet function and perhaps using a Laplace transform as a solution method. Other research should include generalizing the model for use in other karst aquifers, integrating the model with a rainfall-runoff model, and developing a better method for estimating recharge.
Edwards Aquifer Authority Hydrologic Data Report for 2008

Description: Annual report for 2008 on recharge, discharge, water levels and water quality in the Edwards Aquifer San Antonio Region
Report Number: 2-Sep
Location: Edwards Aquifer - San Antonio Area
Summary:This report presents the results of the Authority's Edwards Aquifer Data Collection Program for calendar year 2008.
Water levels at the Bexar County (J-17) index well declined during the first six months of calendar year 2008, falling below the historical mean in June. The aquifer rose above the historical mean in July and maintained above-mean levels until November, when levels approximated the historical mean for the remainder of the year. Other wells in the region exhibited similar behavior.
Precipitation in the Edwards Aquifer region was below the mean in 2008.Total recharge to the Edwards Aquifer was significantly below medianIn calendar year 2008, groundwater discharge from the Edwards Aquifer through wells and springs totaled 845,700 acre-feet. This amount is approximately 20 percent above the median of 705,600 acre-feet for the period of record (1934“2008).Discharge from springs in 2008 was estimated to be 417,000 acre-feet, approximately 8 percent more than the period of record median of 321,100 acrefeet. Springflow was higher early in the year and began to respond to continued drought conditions late in the year.
Detections of compounds for the samples collected were limited to one VOC, limited metals, nitrates below the MCL, and limited bacteria detections.For well water samples collected in 2008, strontium was detected at one location in the freshwater part of the aquifer and at six locations in the saline zone above the 15,000 μg/L PCL. Other metals detected include iron at two locations above the secondary standard and manganese at one location above the secondary standard. Surface and spring water sample analyses did not indicate the presence of any regulated metals above a regulatory limit.
Also for samples collected in 2008, raw groundwater bacteria results from wells ranged from less than two CFU/100 mL to five CFU/100 mL for fecal coliform, and from less than two to six CFU/100 mL for fecal streptococcus.Of the 31 (total number of spring samples) samples, 11 were positive for fecal coliform, whereas 16 of 31 spring samples were positive for fecal streptococcus.
In samples from wells, streams, and springs in the Edwards Aquifer region in 2008, nitrate-nitrite as nitrogen concentrations ranged from below the laboratory reporting limit of 0.015 mg/L to 7.88 mg/L.Of the 31 total spring water samples collected, only one tested positive at a concentration above 2.0 mg/L for nitrates.
The compound tetrachloroethene was detected above the regulatory limit of 5.0 μg/L in one well in Uvalde County at 5.55 μg/L. The well is located within a historical PCE plume. No VOCs were detected in the spring samples nor in the one surface water sample collected for VOC analyses.
No SVOCs were detected in the 2008 sample set.No sample tested positive for [herbicides, pesticides, and PCBs].
Edwards Aquifer water is generally of such high quality that it normally requires only chlorination to meet public drinking-water standards. However, detection of nitrates and organic compounds in the aquifer is a concern, and the Authority will continue to monitor for these compounds to determine possible sources and trends. Nitrate as nitrogen is a naturally occurring compound; however, concentrations above 2.0 mg/L may indicate anthropogenic impacts.
Confirmed detections of anthropogenic compounds such as PCE in Uvalde County are a concern and warrant continued monitoring in the future. The Authority's aquifer-wide water-quality sampling program will continue to monitor wells, streams, and springs for indications of water-quality impacts throughout the region. Focused investigations of areas with water quality impacts will be initiated as needed.
Continued drought conditions that began in the fall of 2007 resulted in declining water levels and springflows in the Edwards Aquifer throughout 2008. Springflows and water levels began the year at above-normal levels but finished the year below normal. The severity of the drought's impact will be determined by the weather patterns for calendar year 2009.
Edwards Aquifer Authority Hydrologic Data Report for 2007
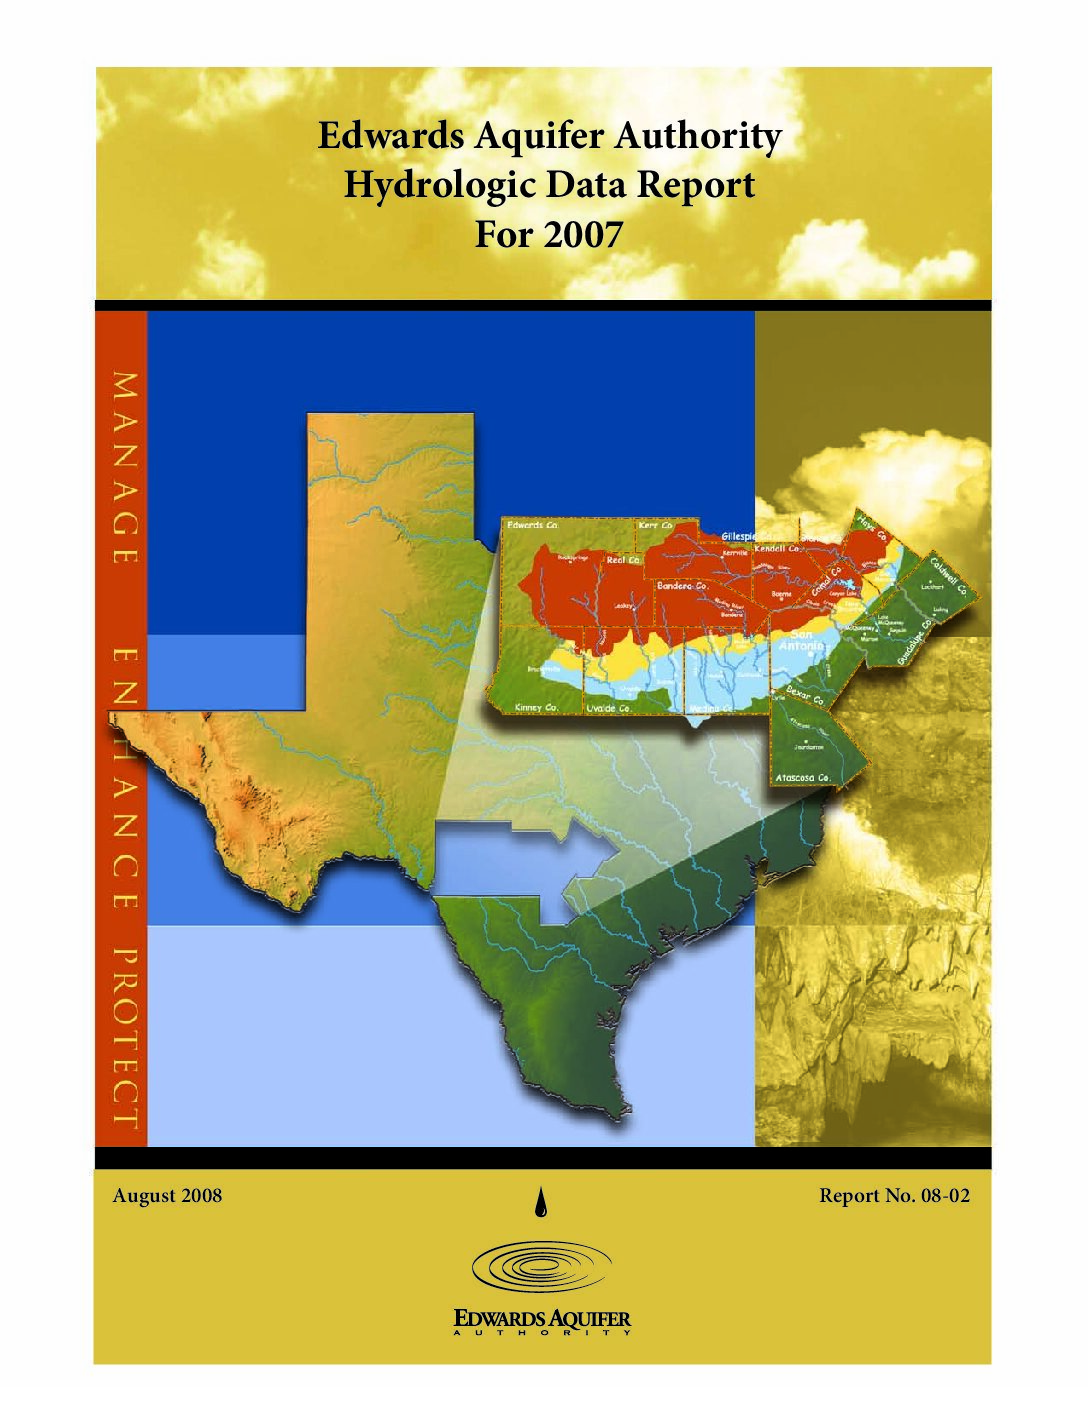
Description: Annual report for 2007 on recharge, discharge, water levels and water quality in the Edwards Aquifer San Antonio Region
Report Number: 2-Aug
Location: Edwards Aquifer - San Antonio Area
Summary:(Excerpted from the report Summary)
This report presents the results of the Authority's Edwards Aquifer Data Collection Program for calendar year 2007.
Except for a few brief periods early in the year, water levels at the Bexar County (J-17) index well were significantly above the historical mean during calendar year 2007. Other wells in the region exhibited similar behavior.
Precipitation in the Edwards Aquifer region was above the mean in 2007.Total recharge to the Edwards Aquifer was very high at 2,162,300 acre-feet in 2007, or approximately 369 percent above the median.In calendar year 2007, groundwater discharge from the Edwards Aquifer through wells and springs totaled 917,900 acre-feet. This amount is approximately 132 percent above the median.
For well water samples collected in 2007, strontium was detected at three locations in the freshwater part of the aquifer and at five locations in the saline zone above the 15,000 μg/L MCL. Other metals detected include iron at one location above the secondary standard. Surface and spring water sample.analyses indicated the presence of mercury at two spring groups above the 2.0 μg/L MCL. Mercury was also detected at two other spring groups at concentrations below the MCL.
For samples collected in 2007, bacteria concentrations indicated a wet year. Raw groundwater bacteria results from wells ranged from less than two CFU/100 mL to 13 CFU/100 mL for fecal coliform, and from less than two to 520 CFU/100 mL for fecal streptococcus. With five wells testing positive for fecal coliform and 11 wells testing positive for fecal streptococcus, two of the wells in the totals above were positive for fecal coliform and fecal streptococcus. Surface and spring water samples also indicated bacteria counts indicative of a wet year. Surface water bacteria ranged from two CFU/100 mL through TNTC for fecal coliform, and from less than two CFU/100 mL through TNTC for fecal streptococcus. Spring water samples for bacteria ranged from less than two through 140 CFU/100 mL for fecal coliform, and from less than two through 73 CFU/100 mL for fecal streptococcus. Two of the wells in the totals above were positive for fecal coliform and fecal streptococcus.
For samples collected in 2007, nitrate-nitrite as nitrogen concentrations ranged from below the laboratory reporting limit of 0.015 mg/L to 10.50 mg/L in samples from wells, streams, and springs in the Edwards Aquifer region. No VOCs were detected in the 48 wells sampled. The compounds 1,3,5-trimethylbenzene, toluene, 1,2,4-trimethylbenzene, m,p-xylene, and naphthalene were detected in spring water samples at concentrations well below their respective MCL and PCL values.
No SVOCs were detected in well samples; however, the compounds phenol and 2-methylnaphthalene were detected in spring water samples in 2007 at concentrations well below the PCL values.No sample tested positive for [herbicides, pesticides, and PCBs].
Edwards Aquifer water is generally of such high quality that it normally requires only chlorination to meet public drinking water standards. However, detection of nitrates and organic compounds, as well as trace quantities of metals such as mercury, in the aquifer is a concern, and the Authority will continue to monitor for these compounds to determine possible sources and trends.
Confirmed detections of anthropogenic compounds such as VOC and SVOC detections at the springs are a concern and warrant continued monitoring in the future. The Authority's aquifer-wide water-quality sampling program will continue to monitor wells, streams, and springs for indications of water-quality impacts throughout the region.
In addition to routine samples collected from wells, streams, and springs in 2007, the Authority analyzed more than 3,000 fluorescence samples from 90 wells during the year in response to the Helotes debris fire. The fire was located primarily over the recharge zone of the aquifer and burned from the end of December 2006 until late March 2007. [S]ome residential wells in close proximity to the fire were impacted by leachate and/or runoff water from fire-fighting activities. This information resulted in development of a unique fire-fighting plan to prevent further impacts to the aquifer, which included regular collection of samples from wells within a two-mile radius of the fire and screening these samples for indicators associated with fire-fighting activities. One of the screening parameters was analyses of samples for organic acids using the Authority's Perkin Elmer LS-50B Luminescence Spectrometer. Regular monitoring, combined with a well-developed plan to limit runoff water, appears to have prevented significant widespread contamination of the aquifer.
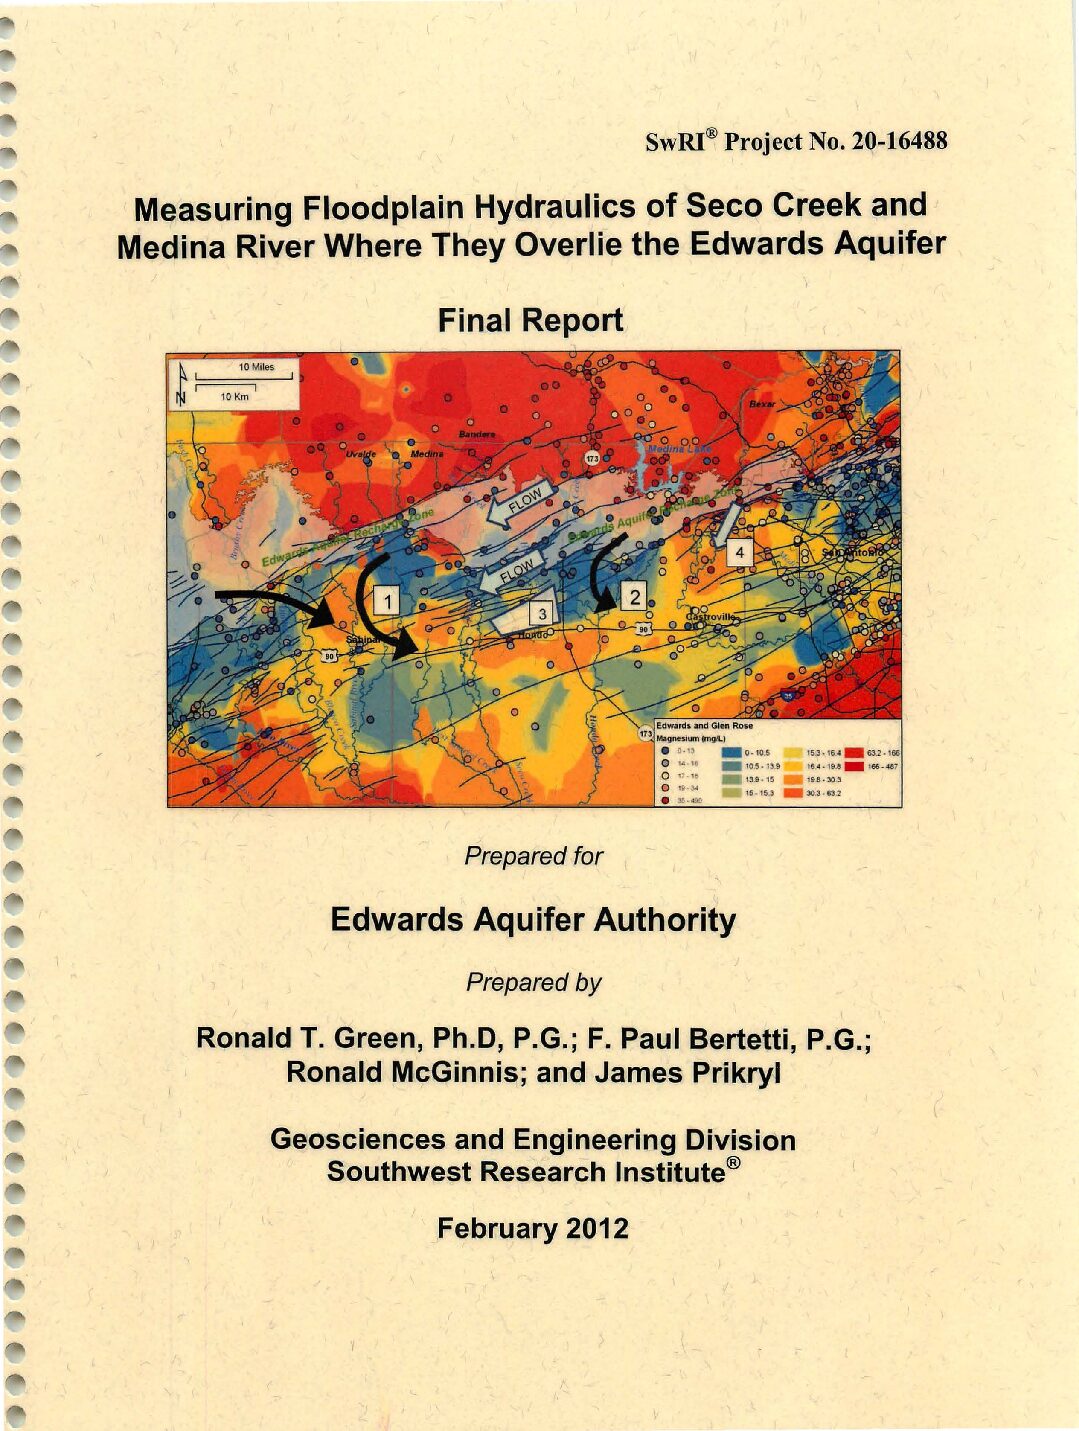
Measuring Floodplain Hydraulics of Seco Creek and Medina River Where They Overlie the Edwards Aquifer Final Report
Description: Study of the hydraulic relationships between Seco Creek, the Medina River, and the Edwards Aquifer
Report Number: SwRI Project 20-16488
Location: Edwards Aquifer, Balcones Fault Zone, San Antonio Segment, Medina County
Summary:Medina County, Texas, hosts significant groundwater resources in a number of alluvial and consolidated rock aquifers. The most significant of these is the Edwards Aquifer, which spans the central portion of the county from its western to eastern boundaries. An estimated 15-25 percent of the recharge of the San Antonio segment of the Edwards Aquifer has been attributed to recharge that occurs in Medina County (Hamilton et al., 2008). Sources of recharge to the Edwards Aquifer typically consist of (i) precipitation on the recharge zone (i.e., autogenic recharge), (ii) surface water focused in river and stream beds (i.e., allogenic recharge) and (iii) as subsurface interformational flow from upstream aquifers. Discharge occurs by spring flow, pumping, and interformational flow to downstream aquifers. To effectively manage the Edwards Aquifer, the water budget must be adequately quantified, and to calculate the water budget within acceptable limits, recharge and discharge of the aquifer must be adequately characterized
Effective management of the Edwards Aquifer requires that its water budget be accurately known. Central to calculation of the water budget of the Edwards Aquifer are recharge and discharge distributions and rates. Current estimates of recharge of the Edwards Aquifer by the Seco and Hondo Creeks and Medina River (i.e., annual medium of 174,600 acre-ft) are predicated on the assumption that underflow in the Seco and Hondo Creeks and Medina River floodplains is negligible and that recharge from these rivers is accurately measured using river flow gauges.
This investigation was undertaken to improve understanding of the hydraulic importance of the Seco Creek and Medina River to the Edwards Aquifer and to evaluate whether this conceptualization of recharge by these rivers is valid. As a secondary objective, hydrogeological and water chemistry data were examined to ascertain the nature of groundwater flow paths in the Edwards Aquifer in Medina County.
In general, the hydrochemical analyses conducted in this study provide support for east to west flowpaths in northern Medina County along fault lines previous investigators proposed (Maclay, 1995; Groschen, 1996; Clark and Journey, 2006). These flowpaths are evaluated both with faults as barriers to flow and with faults not acting as barriers; however, it is likely that faults do play a role in the actual paths for flow within the Edwards Aquifer in Medina County. With the barrier effect added, the chloride and magnesium maps highlight compartmentalization of the aquifer along fault lines, and the maps remain quite consistent with patterns predicted by proposed east to west flowpaths in the north that tum south and east near Sabinal. Adding the barriers does not eliminate the observed plume of more dilute water in the confined zone between Hondo and Castroville.
Hydrochemical data analyses also indicate at least two flowpaths in northern Medina County that flow westward into the confined zone before turning south and eastward near the Medina-Uvalde County boundary and the city of Sabinal, where they mix with eastward flow from Uvalde County. These flowpaths are similar to those Maclay ( 1995), Groschen ( 1996), and Clark and Journey (2006) proposed. The data appear to indicate a shorter flowpath along the southern part of the recharge zone that turns south and eastward between Hondo and Castroville near the Elm-Quihi-Hondo Creek confluence.
This flowpath is consistent with the model flowpath of Maclay ( 1995) and data in Groschen ( 1996), but may not be consistent with the south-central flow path Clark and Journey (2006) proposed. The data indicate an isolated block of higher TDS water just north of Hondo. This isolated block is consistent with data from Groschen ( 1996) and Fahlquist and Ardis (2004). Hydrochemical data indicate a zone of Trinity and Edwards Aquifer mixing west and southwest of Medina Lake near the Medina-Bexar County boundary. These data appear to be consistent with data from Clark and Journey (2006), but are not consistent with their proposed flow path for that area.
Data for the Carrizo-Wilcox Aquifer suggest some recharge connection to an Edwards Aquifer-like source, but more study is required to draw any conclusion regarding the interaction between the Edwards and Carrizo-Wilcox Aquifers south of Medina County.
When combined with the hydrostratigraphic framework of the area, water chemistry, hydraulics, and subsurface imaging can provide the basis to develop a conceptual model of the hydraulic boundary at the southern edge of the Edwards Aquifer recharge zone in central Medina County.
Geologic structure, subsurface imaging, groundwater and surface-water elevations, and water quality of the Leona Formation sediments in central Medina County and the Medina River were examined to evaluate the hydraulic relationships between the Leona Formation sediments and Medina River floodplain systems and the Edwards Aquifer. Seco Creek and Medina River were selected for focused study because of their importance to recharge of the Edwards Aquifer and their suspected importance as modes of discharge from the Edwards Aquifer. In particular, geophysical imaging of the subsurface of the floodplains of Seco Creek and Medina River was conducted to ascertain evidence of paleo-channel deposits or preferential flow pathways developed in the floodplain sediments.
A series of creeks, including Seco, Parker, Live Oak, Hondo, Verde, Elm, and Quihi, provide surface drainage for the Leona Formation in central Medina County. Based on the results of this investigation, paleo-stream channels in the Seco-Parker Creek floodplain are interpreted to flow south until reaching Highway 90, at which point they flow east eventually coalescing with paleo-stream channels associated with the Live Oak floodplain. This interpretation was based on the detection of a significant paleo-stream channel in the Seco-Parker Creek floodplain to the north, but no paleo-stream channel to the south. Consistent with this conceptualization, paleo-stream channels associated with Hondo, Verde, Elm, and Quihi Creeks were interpreted to flow south and eventually coalesce with the Live Oak paleo-stream channel into a single channel about 8-9 miles south of Hondo. This later interpretation was corroborated with hydrochemical analysis, but not verified or quantified by subsurface geophysical imaging.
Significant paleo-stream channel deposits were detected in the Medina River floodplain. The width of the channel deposits exceeds 1 mile. Local well logs confirm the depth of the channel deposits is uniform at about 7 feet. In the absence of an aquifer test, hydraulic properties for the channel deposits were estimated using documented values for a coarse gravel. Using this information, the capacity for underflow in the Medina River floodplain is estimated at 17,500-175,000 acre-ft/year compared with the average annual surface flow of 146,000 acre-ft/year for the Medina River.
In summary, this investigation determined that there is significant underflow in the Medina River floodplain, negligible underflow in the southern Seco Creek floodplain, and potential underflow in the Live Oak/Hondo Creek floodplain, although the magnitude of this potential remains unquantified at this time.
Edwards Aquifer Authority Hydrologic Data Summary for 2007
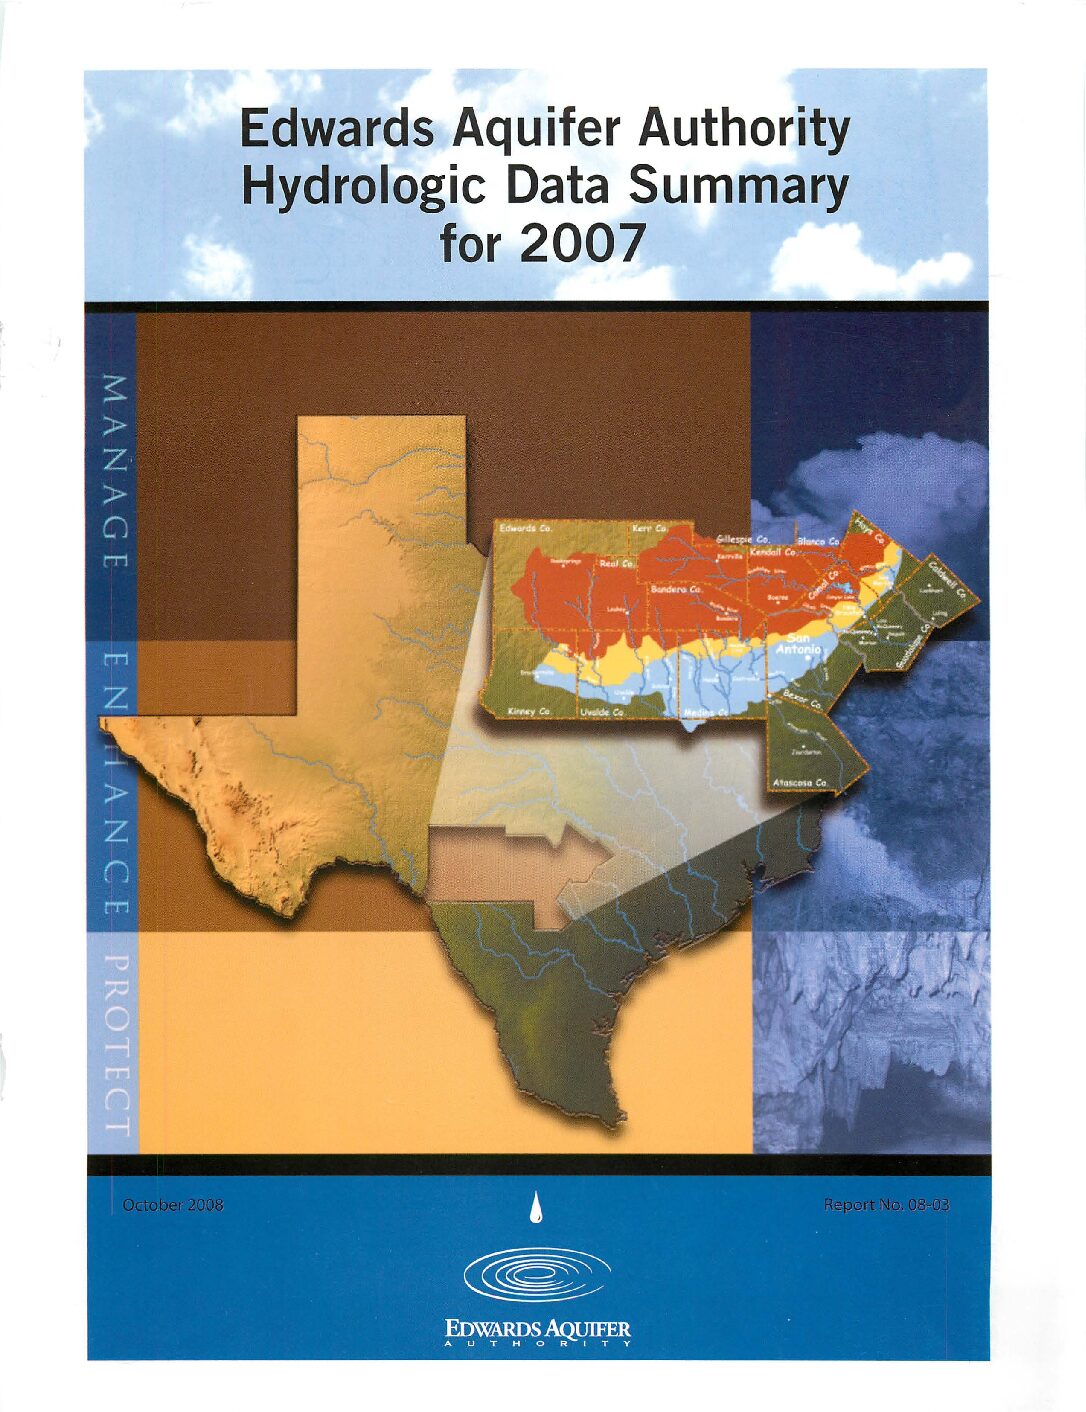
Description: 2007 hydrologic data summary
Report Number: 3-Aug
Location: Edwards Aquifer - San Antonio Area
Summary:Each year, the Edwards Aquifer Authority (Authority) publishes a comprehensive Hydrologic Data Report offering an extensive compilation of data on the Edwards Aquifer, including information on groundwater levels, precipitation, groundwater recharge and discharge, and water quality. This Hydrologic Data Summary is an abbreviated version of the more exhaustive Hydrologic Data Report and serves as a supplement to that report. The full Hydrologic Data Report is available as a PDF on the Authority's website at: www.edwardsaquifer.org.
Edwards Aquifer Hydrogeologic Report for 1994
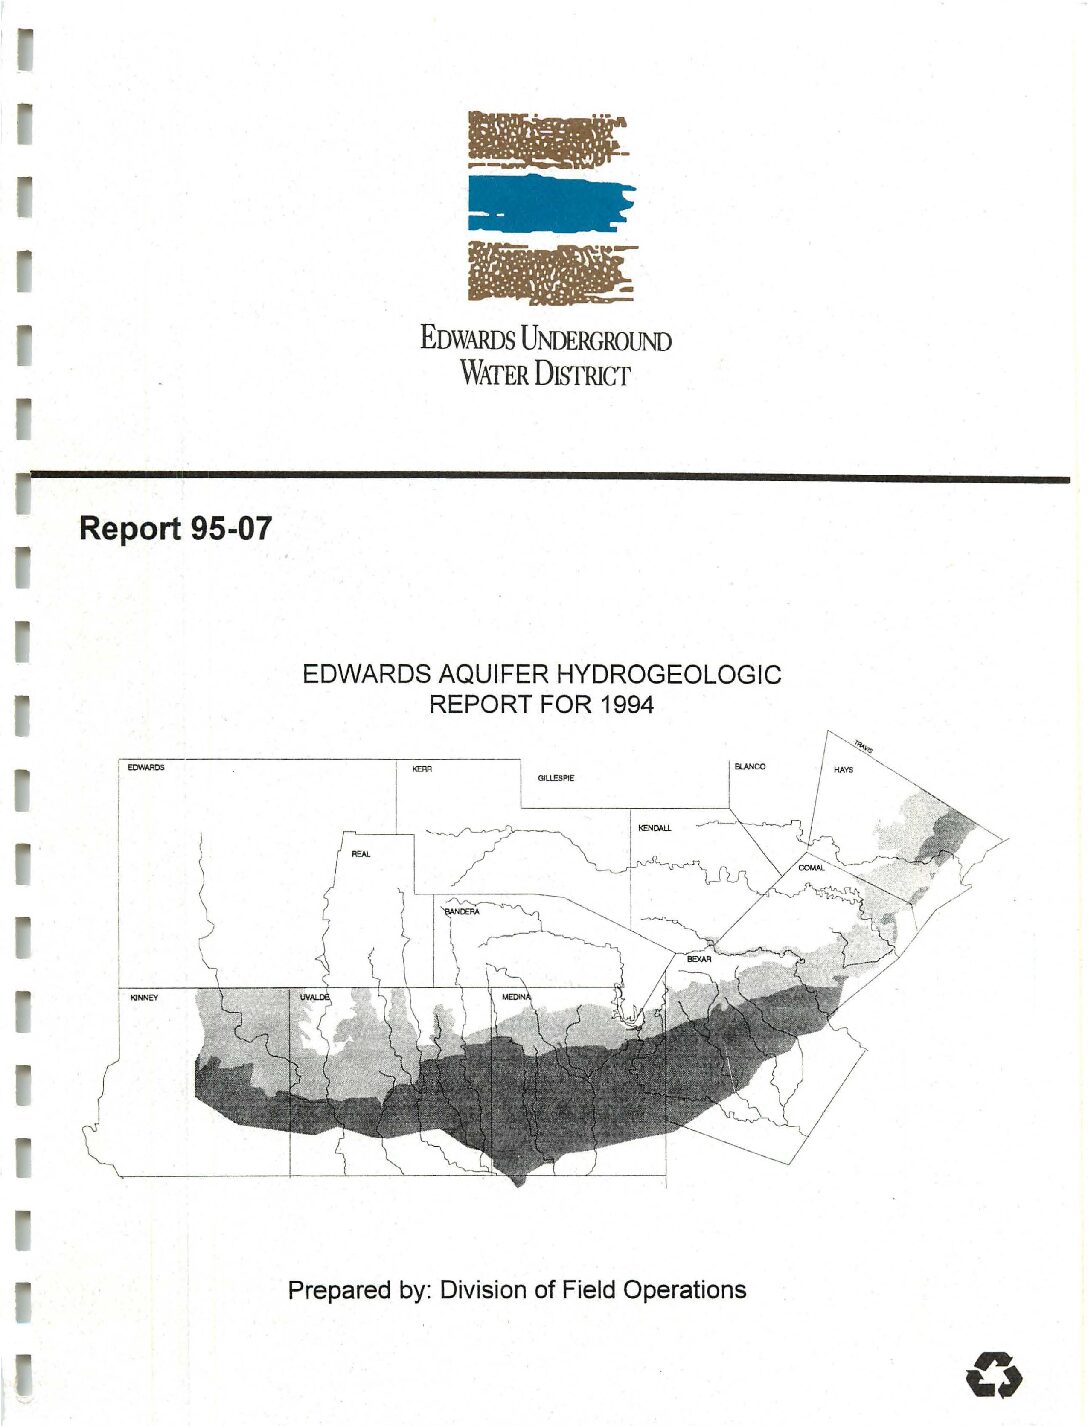
Description: Annual report for 1994 on recharge, discharge, water levels and water quality in the Edwards Aquifer San Antonio Region
Report Number: 95-07
Location: Edwards Aquifer - San Antonio Area
Summary:The average estimated annual groundwater recharge to the Edwards aquifer in the San Antonio area from 1934 through 1994 was 676,600 acre-feet. Recharge in 1994 was 538,100 acre-feet, which was well below the regional average. The lowest annual recharge of 43,700 acre-feet occurred in 1956 and the highest annual recharge of 2,486,000 acre-feet occurred in 1992.
The estimated annual discharge from the Edwards aquifer through wells and springs in 1994 was 814,800 acre-feet, which was the 14th largest calculated annual discharge for the period of record (1934-1994). The lowest annual discharge through wells and springs for the same time period was 388,800 acre-feet which occurred in 1955.
Water level data for wells during 1994 reflected an above average volume of groundwater in storage in the Edwards aquifer during the year. In 1994, the District collected water quality samples from 55 wells, three springs, and seven streams and rivers. These samples were analyzed for 74 constituents and parameters which included common organic constituents, nutrients, dissolved organic carbon, metals and VOCs. Laboratory analyses indicated that samples from 18 wells contained detectable metal concentrations. These concentrations were well below the MCLs for those constituents. No detectable concentrations of pesticides were measured in the wells sampled in 1994. VOCs were detected in four wells at levels well below the limits set by current EPA drinking water standards.
Results of the District's 1994 water quality monitoring program illustrate the continued excellent quality of water in the Edwards aquifer.
Edwards Aquifer Hydrogeologic Report for 1993
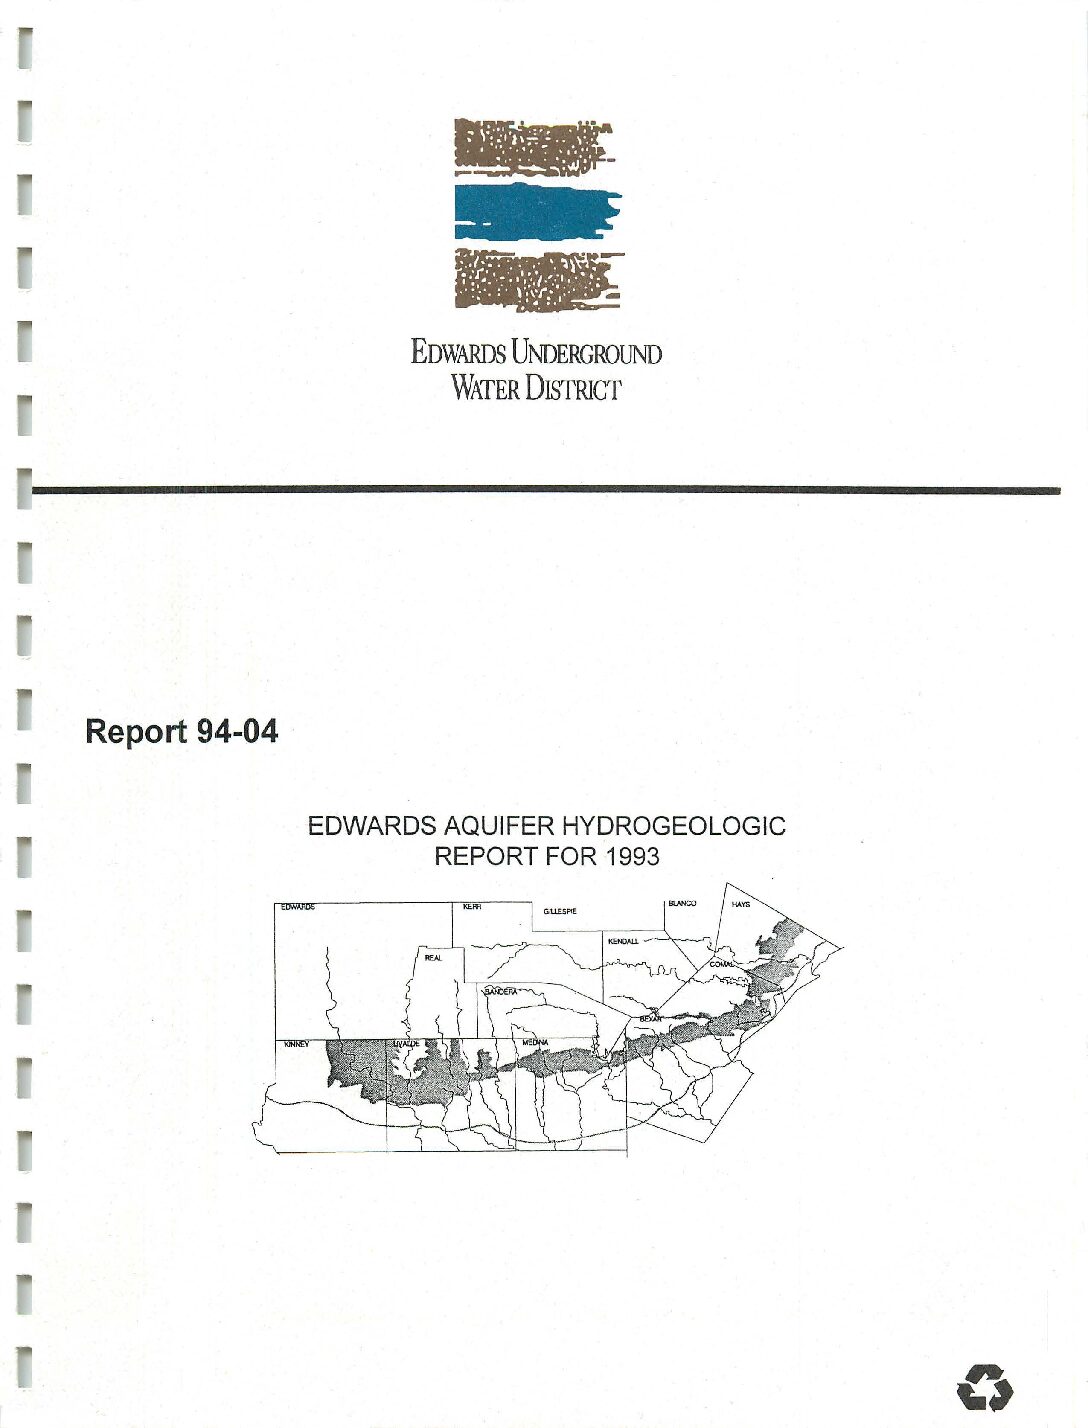
Description: Annual report for 1993 on recharge, discharge, water levels and water quality in the Edwards Aquifer San Antonio Region
Report Number: 94-04
Location: Edwards Aquifer - San Antonio Area
Summary:The average estimated annual groundwater recharge to the Edwards aquifer in the San Antonio area from 1934 through 1993 was 678,900 acre-feet. Recharge in 1993 was 447,600 acre-feet, which was well below the regional average. The lowest annual recharge of 43,700 acre-feet occurred in 1956 and the highest annual recharge of 2,486,000 acre-feet occurred in 1992.
The estimated annual discharge from the Edwards aquifer through wells and springs in 1993 was 996,700 acre-feet, which was the second largest calculated annual discharge for the period of record (1934-1993). The lowest annual discharge through wells and springs for the same time period was 388,800 acre-feet which occurred in 1955. Water level data for wells during 1993 reflected an above average volume of groundwater in storage in the Edwards aquifer during the year.
In 1993, the District with the cooperation with the USGS collected water quality samples from 60 wells and three springs. These samples were analyzed for 88 constituents and parameters which included common organic constituents, nutrients, dissolved organic carbon, metals and VOCs. Laboratory analyses indicated that two wells contained levels of iron above the secondary MCL and one well had a concentration of manganese above the secondary MCL. In addition, 11 out of 191 samples contained detectable concentrations of metals. These concentrations were well below the MCLs for those constituents. No detectable concentrations of pesticides were measured in the wells sampled in 1993. VOCs were detected in one well at a level well below the MCLs for the contaminants. VOC concentrations at levels ranging from 0.2 to 0.3 µg/L were encountered in two other wells sampled in 1993, which were below the limits set by current EPA drinking water standards.
Results of the District's 1993 water quality monitoring program illustrate the continued excellent quality of water in the Edwards aquifer.
Edwards Aquifer Authority Hydrologic Data Report for 2009
Description: Annual report for 2009 on recharge, discharge, water levels and water quality in the Edwards Aquifer San Antonio Region
Report Number: 2-Oct
Location: Edwards Aquifer - San Antonio Area
Summary:This report presents results of the Authority's Edwards Aquifer Data Collection Program for calendar year 2009.
Water levels at the Bexar County (J-17) index well trended downward from January through early September, when rains began and water levels began to rise. By late October, water levels at J-17 had risen to the historical average. Water levels remained above or close to the historical average for the remainder of the year. Other wells in the region exhibited similar behavior.
Precipitation in the Edwards Aquifer region was below the mean in 2009, with the exception of San Antonio, where the mean was exceeded by 0.38 inches. Although rainfall amounts improved in 2009 over calendar year 2008, regionally they were much lower in the west than in the east.Total estimated recharge to the Edwards Aquifer was significantly below median Calendar year 2009 recharge was lower than 2008 recharge by 2,000 acre-feet.In calendar year 2009, groundwater discharge from the Edwards Aquifer through wells and springs totaled 683,765 acre-feet. This amount is below the median total discharge of 766,600 acre-feet for the period of record (1934“2009).
For well-water samples collected in 2009, strontium was detected at one location in close proximity to the saline zone above the 15,000-μg/L PCL. Other metals detected include iron at two locations above the secondary standard and manganese at one location above the secondary standard. Surface and spring water sample analyses did not indicate the presence of any regulated metals above a regulatory limit.
Seven of 74 wells tested positive for fecal coliform, and ten of 74 wells sampled tested positive for fecal streptococcus.Of the 54 spring water samples, 24 were positive for fecal coliform, and 29 for fecal streptococcus.
In samples from wells, streams, and springs in the Edwards Aquifer region, nitrate-nitrite as nitrogen concentrations in 2009 ranged from below the laboratory reporting limit of 0.015 to 6.03 mg/L.The compounds chloroform, chloromethane, and toluene were detected below regulatory limits in wells in Medina, Bexar, and Hays counties. VOCs were not detected in the spring or in surface water samples collected for VOC analyses.No SVOCs were detected. The pesticide compound pentachlorophenol was detected at San Geronimo Creek at 0.25 μg/L.
Edwards Aquifer water is generally of such high quality that it normally requires only chlorination to meet public drinking-water standards. However, detection of nitrates and organic compounds in the aquifer is a concern, and the Authority will continue to monitor for these compounds to determine possible sources and trends.Confirmed detections of anthropogenic compounds such as pentachlorophenol at San Geronimo Creek and toluene, chloroform, and chloromethane in wells are a concern and warrant continued monitoring in the future. The Authority's aquifer-wide, water-quality sampling program will continue to monitor wells, streams, and springs for indications of water-quality impacts throughout the region. Focused investigations of areas with water quality impacts will be initiated as needed.
Statistical Analysis of Water-Level, Springflow and Streamflow Data for the Edwards Aquifer in South-Central Texas
Description: Development of data-based simple and multiple linear regression equations for estimating water levels, springflow and streamflow in the San Antonio region of the Edwards Aquifer
Report Number: USGS 76-393
Location: Edwards Aquifer, Balcones Fault Zone, San Antonio Segment
Summary:Water-level, springflow, and streamflow data were used to develop simple and multiple linear-regression equations for use in estimating water levels in wells and the flow of three major springs in the Edwards aquifer in the eastern San Antonio area. The equations provide daily, monthly, and annual estimates that compare very favorably with observed data.
Analyses of geologic and hydrologic data indicate that the water discharged by the major springs is supplied primarily by regional underflow from the west and southwest and by local recharge in the infiltration area in northern Bexar, Comal, and Hays Counties.
Edwards Aquifer Ground-Water Divides Assessment, San Antonio Region, Texas
Description: Hydrogeologic study on location of groundwater divides in Hays and Kinney Counties
Report Number: 95-01
Location: Edwards Aquifer, Balcones Fault Zone, San Antonio Segment, Hays County, Kinney County
Summary:The Edwards aquifer in the San Antonio region extends approximately 180 miles from the ground-water divide in Kinney County on the western end to the ground-water divide in Hays County on the northeastern end. The exact delineation of the divides has not been clearly defined and has not been located in the same place through the history of hydrogeologic studies of the Edwards aquifer. The areas on the western and eastern ends of the Edwards aquifer in the San Antonio region were studied to evaluate and better delineate the ground-water divides, with the results discussed in this report.
In Hays County, a mound in the water table of the recharge zone results from recharge being focused in an area located along Onion Creek. This area has extensive exposures of Kirschberg evaporite member and numerous faults, which are favorable for the development of secondary porosity and permeability. In the artesian pan of the aquifer, the water-level high may be associated with a preferred flowpath that is directed from the Onion Creek recharge area into the artesian pan of the aquifer, possibly being modified by an unknown subsurface geologic structure. The water-level high in the artesian pan of the aquifer is formed in part by the effects of pumpage in the vicinities of the Cities of Kyle and Buda located on either side of the high and the relative lack of pumping in the area between the two cities. Water levels measured toward the end of summer 1994 in the artesian pan of the aquifer appear to be below the level of San Marcos Springs Lake. This suggests that, during times of lower water levels, the artesian part of the aquifer in this area may not supply water to San Marcos Springs but instead to pumpage near Kyle and Buda and to Barton Springs. A water-level high between Kyle and Buda that is shown by the summer 1994 measurements indicates that flow during this period does not move past San Marcos Springs to Banon Springs. Based on the data from this report, the groundwater divide in Hays County should be located generally between the Cities of Buda and Kyle in the artesian part of the aquifer and along Onion Creek in the Edwards aquifer recharge zone.
In Kinney County, several anticline and syncline folds that plunge to the southwest channel water like a large sheet of corrugated tin toward Las Moras and Pinto Springs. Intrusions of essentially impermeable igneous rocks that generally occur along the axes of the anticlines, which are folded upward, help to magnify the constraining effect of the folds. The intrusions act as a grout curtain where the igneous material has been intruded into the Edwards limestone. Water levels have shown some minor changes through time, but no effects from the filling of Lake Amistad have been detected in the vicinity of the ground-water divide in Kinney County. Two noses appear on the water-level contour maps for Kinney County, both reflective of the underlying anticlines and synclines. However, water-level measurements indicate that a component of flow comes past Las Moras Springs from west to east toward the City of Uvalde.
As a result, the divide should be placed to the west of Las Moras Springs. It probably runs to the north toward Pinto Mountain and then along a topographic high in the unnamed escarpment north of Pinto Mountain. Because stream losses in the West Nueces River are presently used for recharge calculations for the San Antonio region of the Edwards aquifer and water-level contours indicate that a portion of this recharge is moving toward Pinto and Las Moras Springs, discharge of both these springs should be considered as part of any water-balance calculations for the Edwards aquifer in this area.
Report on the Edwards Aquifer San Antonio Region, Texas
Description: Review of geology, hydrogeology, recharge and pumpage of the Edwards Aquifer, Balcones Fault Zone, San Antonio Segment Note: This report is included for its historical value and may have been replaced by more recent studies.
Location: Edwards Aquifer, Balcones Fault Zone, San Antonio Segment
Summary:Review of geology, hydrogeology, recharge and pumpage of the Edwards Aquifer, Balcones Fault Zone, San Antonio Segment.
Description, Formation, Recharge Zone, Artesian Zone, Groundwater Storage, Groundwater Movement, Historical Discharge, Historical Pumpage Spring Flows, Underground River?, Water Quality Issues, Effects of Selected Pumpage on Spring Flow, Revised Emergency Withdrawal Reduction Plan, Bibliography
Records of Wells and Springs, San Antonio Area, Texas
Description: Records of wells and springs in the Edwards Aquifer, Balcones Fault Zone, San Antonio Segment, 1956-1968
Report Number: Bulletin 24
Location: Edwards Aquifer, Balcones Fault Zone, San Antonio Segment
Summary:The purpose of this report is to up-date the published records of wells and springs in the San Antonio area, including all major well developments during the period 1956-68. Previous compilations are contained in the following reports: Petitt and George {1956); Bennett and Sayre {1962); Welder and Reeves {1962); Holt (1959); George (1952); and DeCook (1955) .
The San Antonio area as used in this report is the same area as defined by Garza (1962). It extends from Brackettville to Kyle, varies from 5 to 4o miles wide, and includes all or parts of Bexar, Comal, Hays, Kinney, Medina, and Uvalde Counties (figs. 1-6).
The wells listed in this report are mainly those with large yields that provide water for municipal supply, industrial use, or irrigation. Some smaller yield wells and springs that are being observed in hydrologic studies are included. Most of the wells produce water from the Edwards and associated limestones. A few wells are included that produce from the Glen Rose Limestone, the Carrizo Sand, or other formations.
Edwards Aquifer Hydrogeologic Report for 1997-Plates
Edwards Aquifer Hydrogeologic Report for 1995
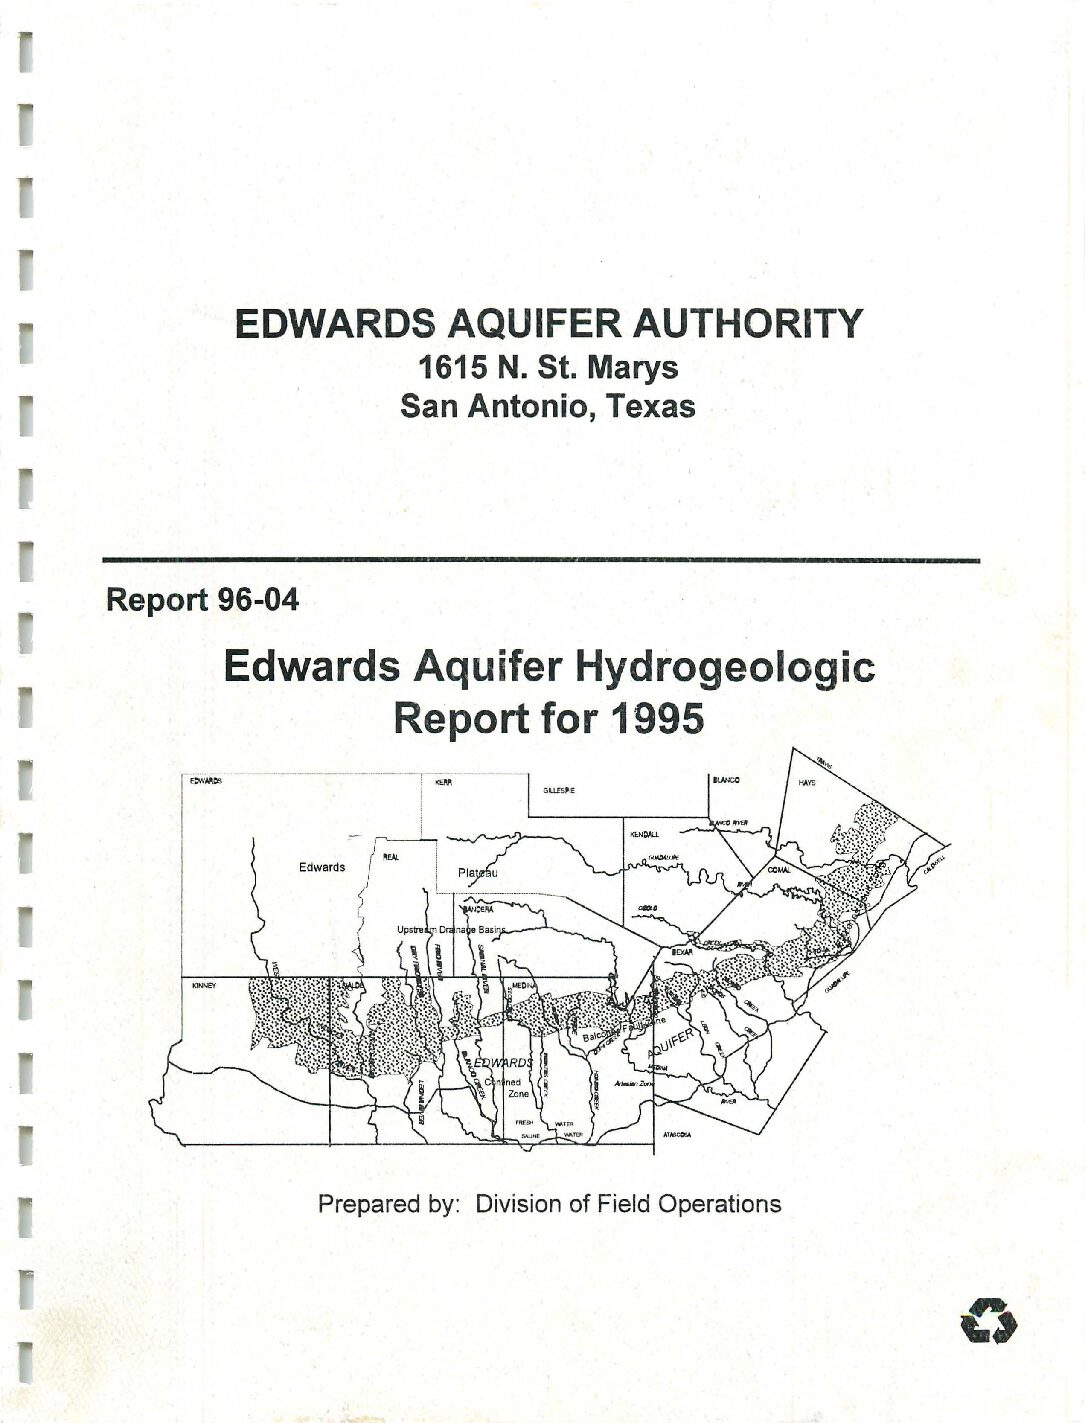
Description: Annual report for 1995 on recharge, discharge, water levels and water quality in the Edwards Aquifer San Antonio Region
Report Number: 96-04
Location: Edwards Aquifer - San Antonio Area
Summary:The average estimated annual groundwater recharge to the Edwards aquifer in the San Antonio area from 1934 through 1995 was 674,200 acre-feet. Recharge in 1995 was 531,300 acre-feet, which was well below the regional average. The lowest annual recharge of 43,700 acre-feet occurred in 1956 and the highest annual recharge of 2,486,000 acre-feet occurred in 1992.
The estimated annual discharge from the Edwards aquifer through wells and springs in 1995 was 761,000 acre-feet. The lowest annual discharge through wells and springs was 388,800 acre-feet which occurred in 1955. Water level data for wells during 1995 reflected a general decrease in Edwards aquifer groundwater in storage during the year.
In 1995, the Edwards Aquifer Authority collected water quality samples from 58 wells, three springs, and seven streams and rivers. These samples were analyzed for 74 constituents and parameters which included common organic constituents, nutrients, dissolved organic carbon, metals and VOCs. Laboratory analyses indicated that samples from 33 wells contained detectable metal concentrations. These concentrations were well below the MCLs for those
constituents. No detectable concentrations of pesticides or VOCs were measured in the wells sampled in 1995.
Results of the Authority's 1995 water quality monitoring program illustrate the continued excellent quality of water in the Edwards aquifer.


