
 Aquifer Conditions
Science & Data Document Library
Science and Data Resources
Analysis of Recharge and Recirculation Edwards Aquifer Phase 2
Description: Use of the MODFLOW model to examine recharge at eight sites in the Edwards Aquifer and discharge at San Marcos Springs
Location: Edwards Aquifer, Balcones Fault Zone
Summary:The Recharge and Recirculation (R&R) Phase 2 Report focuses on Edwards Aquifer responses to recharge as simulated by the Aquifer MODFLOW model. Using the model, aquifer water levels and springflows were evaluated by simulating recharge events at eight different locations across the project area. Numerous combinations of recharge timing, volume, and location were modeled. No specific source of recharge water was considered during Phase 2 analysis. The report contains numerous graphics to demonstrate the relative benefits of the scenarios modeled.
[Excerpted from the Executive Summary]
Phase 2 of the R&R study analyzed the magnitude and duration of increased springflow from enhanced recharge at eight sites considered for development by the South Central Texas Regional Water Planning Group (SCTRWPG, 2001). Objectives for Phase 2 included a comparison of impacts on a site-to-site basis for both a single recharge event and yearly enhanced recharge events over time.
These analyses were conducted with the application of the recently-available USGS MODFLOW model of the Edwards Aquifer (Lindgren, 2004). Given the uncertainties associated with the model and the approved scope of work, a series of model runs were devised to analyze the response of the aquifer and springflows to various scenarios of enhanced recharge. Subsequent model runs used actual estimates for maximum recharge enhancement water under average and drought conditions for the eight recharge sites as summarized by Turner Collie & Braden and LBG Guyton in their 1999 work for EAA (Table 5).,,,
Increases in springflow occur quickly in response to recharge because of the rapid transmission of the pressure wave in the aquifer. However, in most cases the actual water molecules that are recharged remain in the aquifer for a long time.
A summary of the preliminary findings of the Phase 2 analyses based on applications of the USGS MODFLOW model are briefly summarized as follows:
1. On a 5-year recharge basis, Comal Springs flow increases by an amount of water equivalent to 45 to 54 percent of water recharged from the Lower Sabinal, Lower Hondo, Lower Verde, San Geronimo, or Cibolo sites. The remaining sites, Indian Creek, Lower Frio, and Lower Blanco, are less effective in terms of benefits to Comal Springs (see Figure 2).
2. A flow increase in Comal Springs resulting from enhanced recharge at an individual site is independent of water recharged at any other site (see Table 2).
3. Year-round recharge yields more uniform springflow than does seasonal recharge
(see Figure 8).
4. On a continuing recharge basis, Comal Springs flow increases by 0.9 to 1.1 cfs for each 1,000 AF/yr of enhanced recharge into each of the Lower Sabinal, Lower Hondo, Lower Verde, San Geronimo, or Cibolo sites (see Table 3).
5. Tributary runoffs reaching Indian Creek and Lower Blanco recharge sites are the largest of the eight sites but contribute least to Comal Springs flow (see Table 5).
6. Well J-17 shows an increase in water level of about 0.2 foot for each 1,000 AF/yr of continuous recharge into the Lower Sabinal, Lower Hondo, Lower Verde, or San Geronimo sites.
7. Model results indicate that the observed Comal Springs drought of less than 185 days in 1956 would increase to 1,264 days of no flow under the hypothetical situation of 1950s recharge and 1980s pumpage (see Table 8). If all annual average available recharge were applied to a single site (Lower Verde), the no flow period would be reduced to 512 days, and if DMCPM rules were also in effect, the period would be further reduced to zero days.
Edwards Aquifer Authority Hydrologic Data Report for 2003
Description: Annual report for 2003 on recharge, discharge, water levels and water quality in the Edwards Aquifer San Antonio Region
Report Number: 2-Apr
Location: Edwards Aquifer - San Antonio Area
Summary:(Excerpted from the report Summary)
This report presents the results of the Authority's Edwards Aquifer Data Collection Program for calendar year 2003.
Water levels remained well above average at the Bexar County (J-17) index well throughout 2003. Other index wells in the region exhibited similar behavior. Precipitation in the Edwards Aquifer region was generally slightly below average in 2003, except in Hondo where precipitation exceeded the annual average by approximately 21 percent. The highest rainfall volumes were recorded in west central Real, central Bandera, central Medina, and southern Comal counties.
In 2003, total recharge to the Edwards Aquifer was 669,000 acre-feet. This recharge volume is approximately 20 percent above the median of 559,400 acre-feet for the period of record (1934-2003) and approximately four percent below the mean of 698,500 acre-feet for the period of record (1934-2003).
Nitrate as nitrogen concentrations ranged from below the laboratory reporting limit of concentrations were detected above 5.0 mg/L in five wells.
The volatile organic compound (VOC) tetrachloroethene (PCE) was detected in one well sample at a concentration equal to its MCL of 5.0 μg/L. PCE was not detected above the MCL in any of the samples collected in 2003.
The results of the 2003 water quality sampling indicate that water quality in the aquifer is generally excellent. Edwards Aquifer water is generally of such high quality that it normally requires only chlorination to meet public drinking water standards. However, the detection of trace quantities of metals and organic compounds in the aquifer is a concern and the Authority will continue to monitor for these compounds to determine possible sources and trends. Quantification of many of the metals and organic compounds at the low concentrations indicated in the report can be problematic and continued monitoring will be required to confirm their presence or absence.
The Authority's aquifer-wide water quality sampling program will continue to monitor wells, streams, and springs for indications of water quality impacts. Authority staff and cooperating agencies will continue to analyze any anomalous data and investigate possible sources of contamination.
Edwards Aquifer Authority Hydrologic Data Report for 2004
Description: Annual report for 2004 on recharge, discharge, water levels and water quality in the Edwards Aquifer San Antonio Region
Report Number: 2-May
Location: Edwards Aquifer - San Antonio Area
Summary:(Excerpted from the report Summary)
This report presents the results of the Authority's Edwards Aquifer Data Collection Program for calendar year 2004.
Water levels remained above the historical mean value at the Bexar County (J-17) index well throughout 2004. Other wells in the region exhibited similar behavior. Bexar County index well (J-17) reached the second highest water level on record, while monitoring wells in Comal and Hays counties achieved new record highs in 2004.
Precipitation in the Edwards Aquifer region was above mean in 2004, with rainfall amounts ranging from approximately 15 percent above mean in Uvalde County to over 50 percent above mean in Medina, Comal, and Hays counties.
Total recharge to the Edwards Aquifer was 2,176,100 acre-feet in 2004, approximately 388 percent above the median of 560,900 acre-feet for the period of record (1934-2004). Calendar year 2004 is the second highest annual recharge on record.
In calendar year 2004, groundwater discharge from the Edwards Aquifer through wells and springs totaled 937,324 acre-feet. This amount is approximately 38 percent above the median of 679,500 acre-feet for the period of record (1934-2004).
For samples collected in 2004, nitrate-nitrite as nitrogen concentrations ranged from below the laboratory reporting limit to 8.78 mg/L in samples from wells, streams, and springs in the Edwards Aquifer region.
One VOC was detected at or above its associated MCL in two wells. The compound tetrachloroethene (PCE) was detected at 20 μg/L in Bexar County well AY-68-36-601RS, and at 5 μg/L in Uvalde County well YP-69-51-114. The MCL for PCE is 5 μg/L. Additional detections of PCE occurred in five well samples from Bexar County ranging in concentration from 0.02(J, TB) μg/L to 0.8(J) μg/L. One additional SVOC, naphthalene, was detected in a spring sample at 1(J) μg/L.The data flag (J) combined with the other issues relative to these compounds indicates a low probability of contamination issues related to the listed compounds.
In 2004, samples from 23 wells and five spring groups were analyzed for herbicides, pesticides, and PCBs. None of the well samples tested positive for these compounds.No herbicides or PCBs were detected in the spring samples. Pesticide detections in spring samples areGamma ChlordaneAlpha BHC Gamma BHCDelta BHCHeptachlor
Edwards Aquifer water is generally of such high quality that it normally requires only chlorination to meet public drinking water standards. However, the detection of nitrates and trace quantities of metals and organic compounds in the aquifer is a concern and the Authority will continue to monitor for these compounds to determine possible sources and trends.
Nitrate as nitrogen was detected frequently with the highest concentrations detected in well water samples. Quantification of many of the metals and organic compounds at the low concentrations indicated in the report can be problematic and continued monitoring will be required to confirm their presence or absence. However, the confirmed detections of organic compounds such as PCE in Uvalde and Bexar counties is a concern, and warrants additional monitoring in the future.
The Authority's aquifer-wide water quality sampling program will continue to monitor wells, streams, and springs for indications of water quality impacts. Authority staff and cooperating agencies will continue to analyze any anomalous data and investigate possible sources of contamination.
Edwards Aquifer Authority Hydrogeologic Report for 2002
Description: Annual report for 2002 on recharge, discharge, water levels and water quality in the Edwards Aquifer San Antonio Region
Report Number: 2-Mar
Location: Edwards Aquifer - San Antonio Area
Summary:(Excerpted from the report Summary)
This report presents the results of the Authority's Edwards Aquifer Data Collection Program for calendar year 2002.
Throughout most of the year water levels exceeded average levels in the Authority's index wells in Uvalde, Hondo, and San Antonio. Below average precipitation in the late spring and early summer resulted in water levels falling to the level where water use restrictions would be required. Above average precipitation in late June and July was sufficient to recharge the aquifer and reduce demand, which moderated the typical seasonal decline of water levels for that time of year. Consequently, the Authority did not institute water use restrictions during the summer of 2002.Weather conditions during 2002 limited the number of days cloud seeding operations could be performed under the Authority's Precipitation Enhancement Program.
Total recharge to the Edwards Aquifer was 1,665,200 acre-feet in 2002, approximately 230 percent above average for the period of record (1934-2002). Only 1958, 1987, and 1992 experienced higher recharge volumes.The water level at J-17 reached a high for the year of 697.9 feet msl on November 10, 2002, representing the third highest annual maximum for the period of record for this well.
In 2002 discharge from the Edwards Aquifer through wells and springs totaled 997,100 acre-feet, which exceeded the average for the period of record (1934-2002). For the period of record, 2002 experienced the second highest annual discharge from springs, exceeded only by the 1992 discharge value. The above average precipitation, recharge, and aquifer water levels in 2002 resulted in the above average springflow.
Water samples from each sampling event were analyzed for major ions, metals, TDS, hardness, and nutrients. Water samples collected from 16 wells, the nine stream locations, and the five spring groups were also analyzed for pesticides and herbicides. Water samples from 27 wells and the five spring groups were also analyzed for volatile organic compounds (VOCs). Water samples from 11 wells and the five spring groups were also analyzed for semivolatile organic compounds (SVOCs).
For the samples collected in 2002, thallium was detected slightly above the MCL of 0.002 mg/L in water samples from seven wells, five of which are located in the saline zone. Two other metals, antimony and silver, were detected in three wells in the freshwater portion of the aquifer at concentrations slightly above their respective MCLs. Antimony was also detected at concentrations slightly above the MCL in three surface water and five spring water samples. Currently, no trends for these metals are indicated by the sample results; however, continued monitoring at these wells will indicate if any trends are developing.
For samples collected in 2002, nitrate concentrations ranged from below the laboratory reporting limit to 7.48 mg/L in samples from wells, streams, and springs in the Edwards Aquifer region. None of the samples collected exceeded the MCL of 10 mg/L for nitrate.
The herbicides ethoprop, silvex, and dicamba were detected in three well samples at 0.077 μg/L, 0.061 μg/L, and 0.09 μg/L, respectively. The herbicides ethoprop and atrazine were each detected in one stream sample at 0.076 μg/L and 0.10 μg/L, respectively. No herbicides were detected in spring water samples. The pesticide compounds lindane and diazinon were detected in one well sample at 0.01 μg/L and 0.014 μg/L respectively. The pesticide compound diazinon was detected in one stream sample.
Five well samples contained detectable concentrations of tetrachloroethene (PCE). Well YP-69-51-114, located in the City of Uvalde, contained PCE at 4.0 μg/L. The other four wells, located in Bexar County, contained PCE at concentrations ranging from 0.4 to 0.8 μg/L (concentrations less than the laboratory reporting limit). The MCL for PCE is 5.0 μg/L.
Water quality in the aquifer is generally excellent. Edwards Aquifer water is generally of such high quality that it normally requires only chlorination to meet public drinking water standards. However, the detection of VOCs and nitrate in the aquifer is a concern and the Authority will continue to monitor for these compounds to determine possible sources and trends. The Authority's aquifer-wide water quality sampling program will continue to monitor wells, streams, and springs for indications of water quality impacts. Authority staff and cooperating agencies will continue to analyze any anomalous data and investigate possible sources of contamination.
Edwards Aquifer Authority Hydrogeologic Report for 2001
Description: Annual report for 2001 on recharge, discharge, water levels and water quality in the Edwards Aquifer San Antonio Region
Report Number: 1-Feb
Location: Edwards Aquifer - San Antonio Area
Summary:(Excerpted from the report Summary)
This report presents the results of the Authority's Edwards Aquifer Data Collection Program for calendar year 2001.
Precipitation in the Edwards Aquifer region was generally above normal in 2001, especially in the spring and fall. Water levels generally exceeded average levels in the Authority's index wells in San Antonio, Hondo, and Uvalde.During the summer, there was sufficient rainfall to recharge the aquifer and reduce demand, which moderated the typical seasonal decline of water levels for that time of year. Consequently, the Authority did not institute water use restrictions during the summer of 2001.
Total recharge to the Edwards Aquifer was 1,069,400 acre-feet in 2001, approximately 50 percent above average.Discharge from the Edwards Aquifer through springs and wells totaled 897,200 acre-feet, which also exceeded average values.
The water samples were analyzed for major ions, metals, TDS, hardness, and nutrients. Concentrations of major constituents are relatively uniform throughout the freshwater parts of the Edwards Aquifer. The freshwater portion of the aquifer consistently yields very hard, calcium bicarbonate water with low TDS and few detectable metals. It is generally of such high quality that it usually only requires chlorination to meet public drinking water standards. Samples from two wells in the freshwater/saline water transect in San Marcos contained arsenic (LR-67-01-814A) and lead (LR-01-813A) concentrations above their MCLsLike groundwater from the freshwater areas, water from springs and streams also contain low concentrations of TDS and few detectable metals.
The water quality analyses also revealed organic chemicals in samples from two wells and two streams. Tetrachloroethene was detected at 7.6 μg/L in the sample from well YP-69-51-114 in Uvalde County. The source is an industrial dry cleaning operation that was destroyed by fire in 1979. Tetrachloroethene has been detected in this well and other wells in Uvalde since 1983, and the TNRCC has an agreed order with the responsible party for investigation and cleanup. Tetrachloroethene also was detected at 0.57 μg/L in the sample from well AY-68-29-414 in Bexar County. The Authority and TNRCC are investigating the source.
The herbicide, 2,4,5-T, was detected at 0.028 mg/L in the sample from the Hondo Creek at Tarpley on November 29, 2001. EPA banned this herbicide in 1970. Finally, pentachlorophenol was detected at 0.019 μg/L in the sample from Seco Creek at Miller Ranch collected on November 29, 2001. Pentachlorophenol is a wood preservative for utility poles, railroad ties, and other materials. Except for the tetrachloroethene detected in the Uvalde well, the concentrations of the organic compounds are below established levels for drinking water standards. The Authority will continue to monitor these locations to assess long-term data trends and investigate possible sources of the contaminants.
Nitrate concentrations ranged from less than 0.01 mg/L to 4 mg/L in samples from most wells and streams in the Edwards Aquifer region. The concentration in only one sample (TD-69-31-603) exceeded the MCL (10 mg/L); the Authority is studying the trends of nitrate concentrations for evidence of contamination sources in the aquifer.
The Authority continues its programs to protect the generally excellent water quality of the aquifer through investigating groundwater contamination and identifying and analyzing anomalous data from the Authority's aquifer-wide sampling program.
2011 Edwards Aquifer Hydrologic Data Fact Sheet for Recharge and Discharge
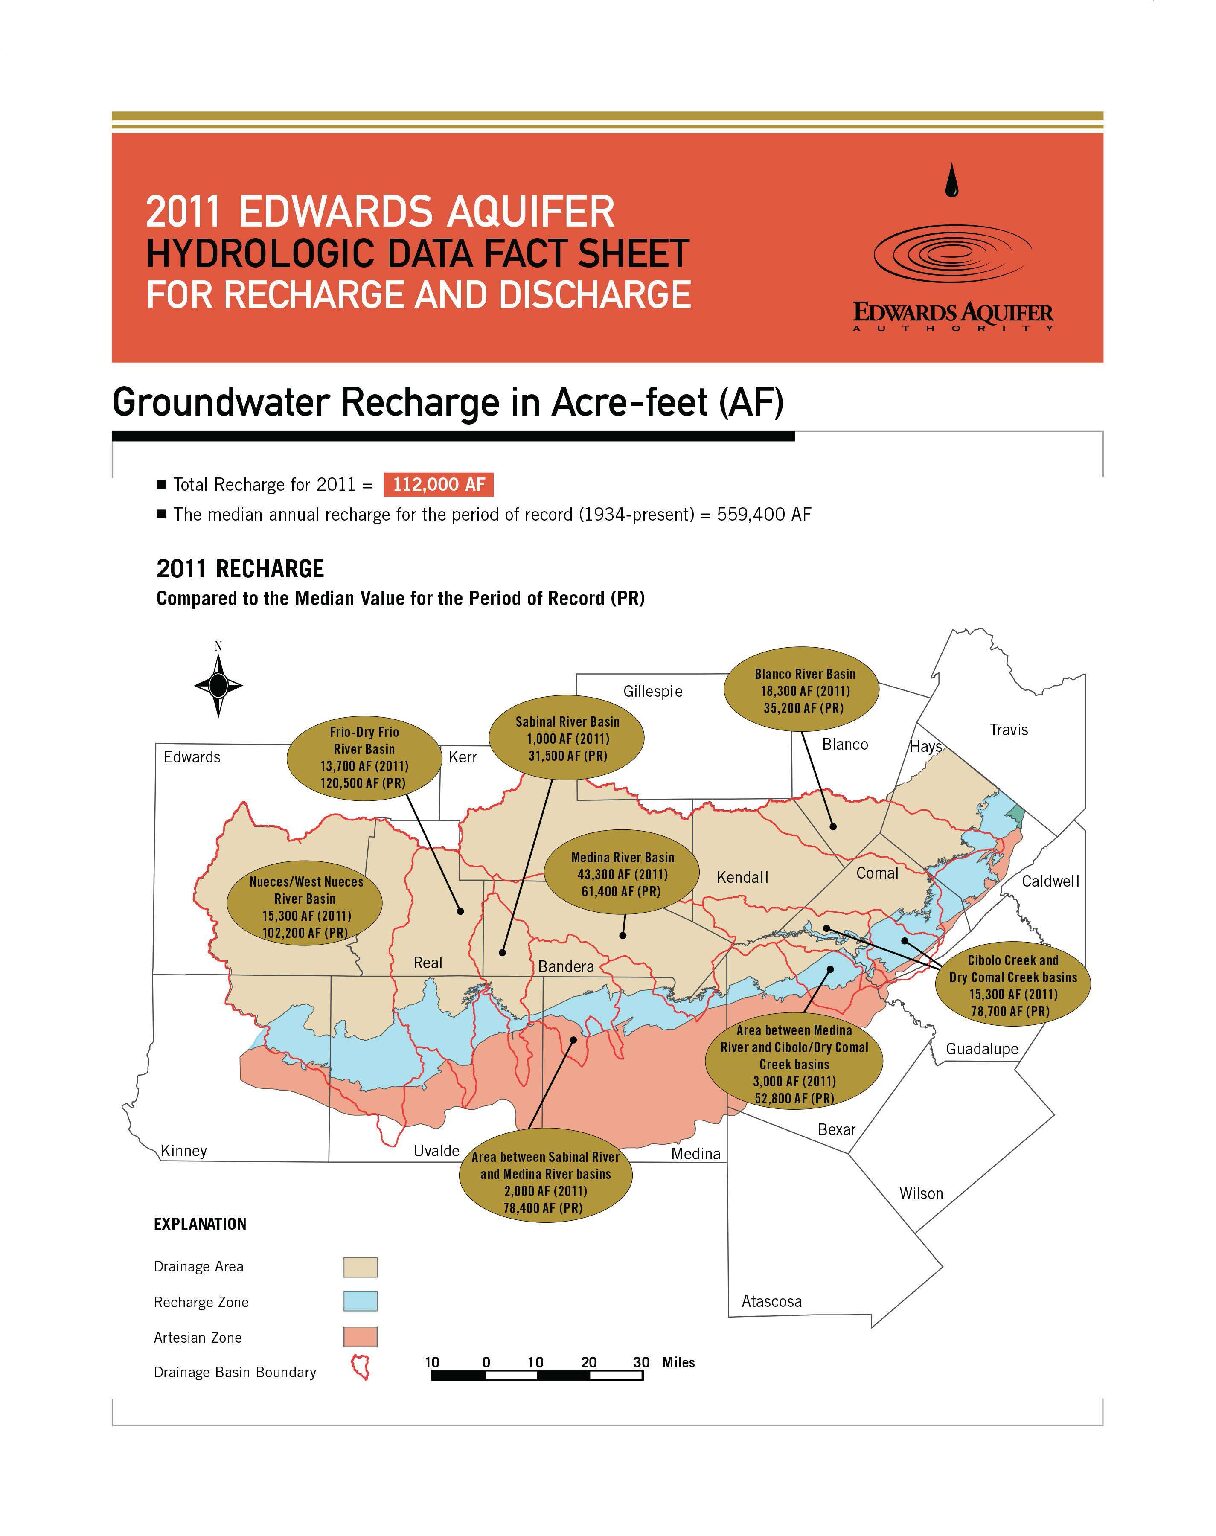
Description: 2011 Edwards Aquifer Hydrologic Data Fact Sheet for Recharge and Discharge
Location: Edwards Aquifer - San Antonio Area
Summary:Each year, the Edwards Aquifer Authority (Authority) publishes a comprehensive Hydrologic Data Report offering an extensive compilation of data on the Edwards Aquifer. This fact sheet is a sampling of the information that can be found in that report.
2010 Edwards Aquifer Hydrologic Data Fact Sheet for Recharge and Discharge
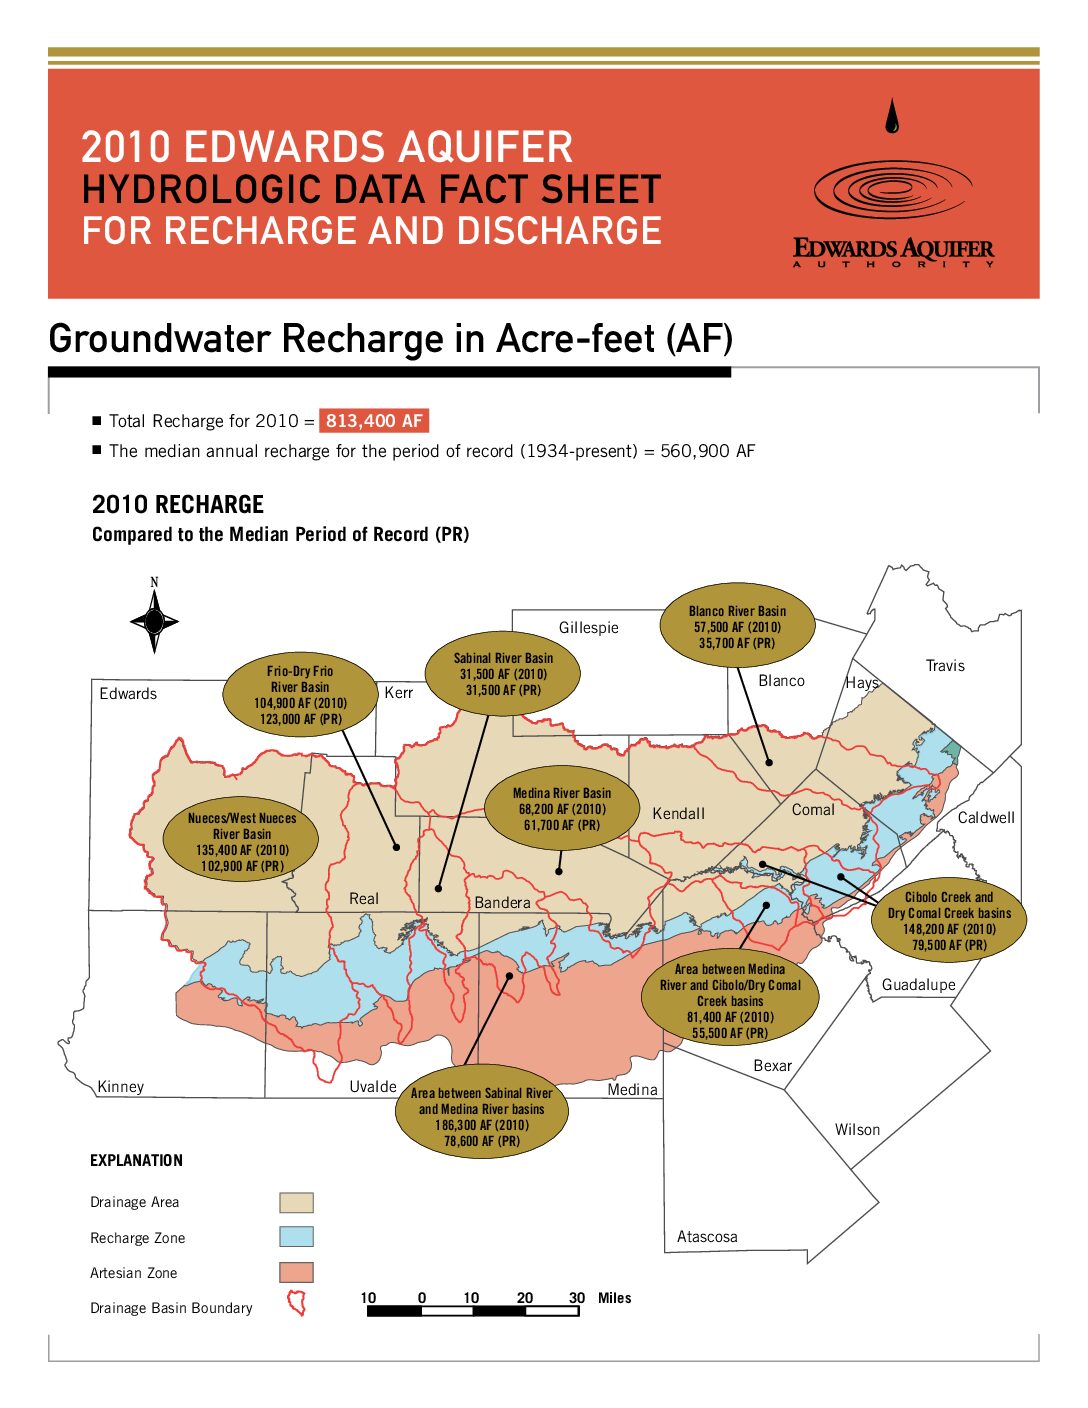
Description: Summary for 2010 on recharge and discharge in the Edwards Aquifer San Antonio Region
Location: Edwards Aquifer - Balcones Fault Zone - San Antonio Segment
Summary:Each year, the Edwards Aquifer Authority (Authority) publishes a comprehensive Hydrologic Data Report offering an extensive compilation of data on the Edwards Aquifer. This fact sheet is a sampling of the information that can be found in that report.
Edwards Aquifer Authority Hydrogeologic Data Report for 1999
Description: Annual report for 1999 on recharge, discharge, water levels and water quality in the Edwards Aquifer San Antonio Region. Note: Largeformat versions of the plates for this report are available at: https://www.edwardsaquifer.org/documents/2000_Esquil inetal_1999HydrologicDataPlates.pdf.
Report Number: 00-02
Location: Edwards Aquifer - San Antonio Area
Summary:In 1999, discharge from the Edwards Aquifer was greater than recharge as demonstrated by periods of decreasing water levels. The net decrease in water levels in the Bexar County index well was 22.6 feet for the year. The amount of rain received in the San Antonio region in 1999 was approximately 45% below normal.
The average estimated annual groundwater recharge to the Edwards Aquifer in the San Antonio region from 1934 through 1999 is approximately 680,000 acre-feet. Recharge in 1999 was approximately 473,400 acre-feet. The lowest annual recharge of 43,700 acre-feet occurred in 1956, and the highest annual recharge of 2,486,000 acre-feet occurred in 1992.
Estimated annual discharge from the Edwards Aquifer through wells and springs in 1999 was 898,800 acre-feet. The lowest annual discharge through wells and springs was 388,800 acre-feet, which occurred in 1955. Spring discharge from the Edwards Aquifer for 1999 was calculated at 456,100 acre-feet or 51 percent of the total discharge. Groundwater pumping accounted for 442,700 acre-feet of water discharged from the Edwards Aquifer in 1999. In general, water level data during 1999 reflected a decrease in water recharging the aquifer, although there was a decrease in pumping relative to 1998.
In 1999, the Authority collected water quality samples from 57 wells, two springs and eight stream basins. The water samples were analyzed for major ions, minor element metals, TDS, hardness and nutrients. Water samples from 12 wells, two springs and eight surface water locations were also analyzed for pesticides and herbicides. Water samples from eight wells and one spring were also analyzed for VOCs. None of the constituents analyzed were detected above published MCLs. No pesticides, herbicides, or VOC's were detected in the water samples analyzed for these compounds.
Evaluation of the Aquifer and Springflow Impacts Associated with the Cibolo Creek Transfer Rules
Description: Use of data and modeling to determine effects on springflow in Comal and San Marcos Springs from Cibolo Transfers (transfers of permits from Bexar to eastern counties)
Location: Bexar County, Hays County, Comal County
Summary:The purpose of this study was to use available data and the Authority's MODFLOW groundwater model to assess the impact to aquifer water levels and springflow from the transfer of water rights from Bexar County and the western counties to Comal and Hays Counties. Water right transfers from Bexar County and west into Comal and Hays Counties are referred to as Cibolo transfers because Cibolo Creek is the geographic feature between the two areas. The study was completed on April 13, 2006 by LBG-Guyton Associates, Austin, Texas.
This study was designed to use available data and the EAA MODFLOW groundwater model to assess the impact of Cibolo transfers on aquifer water levels and springflow.
An evaluation of current permits and transfers show that 58 percent of the transfers originate in Bexar County, followed by Medina (26%) and Uvalde (16%). Transfers make 0.51 percent of total permits. Comal County receives the largest portion of transfers (94%) followed by Hays (4%), and Guadalupe (2%).
Assessment of the faults and springs in the MODFLOW model indicates that the model is generally consistent with the current conceptual model of the aquifer. Based on the modeling methodology used for this study, it is clear that Cibolo transfers impact springflow from San Marcos and Comal Springs.
The model results indicate that the withdrawal location of the transfer can affect the amount of impact that the transfer has on flow from individual springs and on the total springflow. Cibolo transfers generally have a negative effect on San Marcos springflow because San Marcos Springs are located at the end of the flow system, and thus are generally affected by upgradient withdrawals. Model results indicate that on average, San Marcos springflow may be decreased from 0 to 92% of the transfer volume. In seasonally high summer pumping, San Marcos springflow may be decreased from 4 to 313% of the transfer volume. Model results indicate that on average, the impact to Comal springflow ranges from a 51% increase to a 35% decrease of the transfer volume. During peak summer pumping, the maximum impact to Comal springflow ranges from an increase of 7 percent to a decrease of 203 percent of the transfer volume.
Water levels in the Bexar County index well (J-17) increase slightly due to transfers, suggesting that CP/DM triggers for the San Antonio pool would be reached slightly later during any particular dry period then they would have prior to the transfer.
Edwards Aquifer Hydrogeologic Report for 2000
Description: Annual report for 2000 on recharge, discharge, water levels and water quality in the Edwards Aquifer San Antonio Region
Report Number: 2-Jan
Location: Edwards Aquifer - San Antonio Area
Summary:(Excerpted from the report Summary)
In 2000, total discharge from the San Antonio segment of the Balcones fault zone Edwards Aquifer (the aquifer) exceeded recharge. Above average rainfall in the later portion of the year resulted in a net gain in aquifer storage as demonstrated by higher water levels in most index wells at the end of the year relative to the beginning of the year. The net increase in the Bexar County index well for 2000 was 13.1 feet. The amount of rain received in the San Antonio area in 2000 was approximately 19% above average.Recharge in 2000 was estimated to be 614,500 acre-feet.
In 2000, the following minor element metals were detected at or above a drinking water standard (Standards in 40 CFR Part 141, 40 CFR Part 143, and EPA's lead and copper rules): Lead Mercury Cadmium
The cadmium concentrations above the MCL were detected in water samples from freshwater/saline water interface monitoring wells. The lead and mercury concentrations were detected in freshwater wells at concentrations just above the MCL. These wells will continue to be monitored for minor element metal concentrations to assess any trends of concern.
Water samples from three freshwater/saline water interface monitoring wells in Bexar County and five freshwater/saline water interface monitoring wells in Hays County contained fluoride concentrations above the MCL of 4.0 mg/L. Water samples from several other wells, primarily freshwater/saline water interface monitoring wells, contained fluoride above the secondary drinking water standard of 2.0 mg/L. These fluoride concentrations are believed to be naturally occurring.
Water samples from several wells contained nitrate concentrations above the MDL. However, none of the nitrate concentrations exceeded the MCL. In general, relatively higher nitrate concentrations were detected in the Uvalde area.
The VOC tetrachloroethene (PCE) was detected in a well in Uvalde County (YP- 69-51-114) at a concentration of 7 µg/L. The MCL for tetrachloroethene is 5µg/L. The TNRCC is working with the responsible party to address the tetrachloroethene contamination.
Comal and Hueco springs were sampled numerous times in 2000 in response to a release of approximately 2,800 gallons of diesel fuel from an above ground storage tank. The release occurred in January 2000 on the recharge zone approximately four miles southwest of New Braunfels. VOCs and SVOCs of an unknown origin were detected at Comal and Hueco springs in late January and early February 2000. The VOC and SVOC concentrations were not detected in subsequent samples collected from Comal and Hueco springs. No VOCs or SVOCs were detected at San Pedro or San Marcos Springs. The VOCs and SVOCs detected at Comal Springs were: 2-methyl naphthalene naphthalene total xylenes.
The VOCs and SVOCs detected at Hueco Springs were: 2-methyl naphthalene naphthalene. The origin of the VOCs and SVOCs detected at Comal and Hueco Springs continues to be investigated.
Edwards Aquifer Authority Hydrologic Data Report for 2006
Description: Annual report for 2006 on recharge, discharge, water levels and water quality in the Edwards Aquifer San Antonio Region
Report Number: 1-Jul
Location: Edwards Aquifer - San Antonio Area
Summary:(Excerpted from report Summary)
This report presents results of the Authority's Edwards Aquifer Data Collection Program for calendar year 2006.
Water levels were generally below the historical mean value at the Bexar County (J-17) index well throughout 2006. Other wells in the region exhibited similar behavior. In 2006, aquifer (groundwater) levels were adversely affected by the continuing drought conditions across the region, resulting in water levels that were lower than those recorded in calendar year 2005.
Precipitation in the Edwards Aquifer region was below the period of record mean in 2006.Total recharge to the Edwards Aquifer was 201,600 acre-feet in 2006, or approximately 36 percent of the median value of 560,900 acre-feet for the period of record (1934-2006).In calendar year 2006, groundwater discharge from the Edwards Aquifer through wells and springs totaled 768,400 acre-feet. This amount is approximately 12 percent above the median value of 683,500 acre-feet for the period of record (1934-2006).
Water samples from most sampling events were analyzed for major ions, metals, TDS, hardness, and nutrients. Wells and spring groups were also analyzed for VOCs. Water samples from 10 wells and all spring groups were analyzed for SVOCs. Water samples collected from wells, stream locations, and spring groups were also analyzed for pesticides, herbicides, and PCBs.
For well water samples collected in 2006, mercury was detected at one location in the saline zone at 2.7 μg/L, slightly above the 2.0 μg/L MCL. Other metals detected included strontium and iron, at concentrations above their respective PCLs, or secondary standards. Surface water sample analyses did not indicate the presence of any analyzed metals above their respective standards. Spring water samples indicated the presence of mercury, thallium, and antimony at concentrations below MCLs and PCLs in 2006.
For samples collected in 2006, nitrate-nitrite as nitrogen concentrations ranged from below the laboratory reporting limit of 0.015 mg/L to 6.70 mg/L in samples from wells, streams, and springs in the Edwards Aquifer region.In 2006, wells and springs were all analyzed for VOCs; carbon disulfide was detected at trace amounts in Hays County, as was chloroethane. These detections were well below their PCL values. In addition, these detections were from wells within the saline water zone of the aquifer. Laboratory quality assurance data indicated the presence of carbon disulfide in the associated trip blanks.
No SVOCs were detected at or above their associated MCLs in wells sampled. However, the compound bis(2-ethylhexyl)phthalate was detected at 11.4 μg/L in the sample from Las Moras (Fort Clark) Springs. The MCL for bis(2-ethylhexyl)phthalate is 6.0 μg/L. One additional SVOC, phenol , was detected in this sample at concentrations below the MCL. The pesticide compound malathion was detected in a well in Uvalde County in trace amounts.
Edwards Aquifer water is generally of such high quality that it normally requires only chlorination to meet public drinking water standards. However, detection in the aquifer of nitrates and organic compounds, as well as trace quantities of metals, is a concern, and the Authority will continue to monitor for these compounds to determine possible sources and trends. Nitrate as nitrogen was detected frequently in all sample types; however, well samples had the highest concentrations, with 24 of 76 wells sampled testing positive for nitrate-nitrite at 2.0 mg/L or higher. One of the 76 wells had nitrate-nitrite concentrations above 5.0 mg/L; the MCL for nitrate-nitrite is 10 mg/L.
Confirmed detections of anthropogenic compounds, such as malathion from a Uvalde County well and SVOC detections at Las Moras Springs, are a concern and warrant continued monitoring in the future. The Authority's aquifer-wide water-quality sampling program will continue to monitor wells, streams, and springs for indications of water-quality impacts throughout the region.
In addition to the routine water quality samples discussed previously, the Authority collected 123 special samples from 24 wells in response to the release of raw sewage over the recharge zone of the aquifer at two different locations in 2006. The first incident occurred between December 2005 and January 2006, at Evans Road and Highway 281 in north Bexar County. The second incident occurred in Hollywood Park, also in north Bexar County. Both incidents occurred as a result of failed pressurized sewer lines. Although some bacterial samples were positive, none of the samples indicated a positive interception of the anticipated plume of sewage.
Final report as required by the Endangered Species Program, Texas: grant no. E-38-HP: endangered and threatened species conservation: habitat conservation planning for the development of the Edwards Aquifer Authority habitat conservation plan
Description: Summary of progress on development of the Habitat Conservation Plan (HCP) to protect the Comal and San Marcos spring ecosystems and mitigate any incidental take of listed species that would occur as a result of low spring flows, and Environmental Impact Statement (EIS) for description of the preferred alternative
Report Number: Grant E-38-HP
Location: Comal Springs, San Marcos Springs, Atascosa County, Bexar County, Caldwell County, Comal County, Guadalupe County, Hays County, Medina County, Uvalde County
Summary:1) Inclusion of the results of additional biologic modeling and evaluation studies that were completed in 2003 and 2004. A revised Draft January 2004 HCP/EIS was completed and delivered to the Authority for internal review.
2) Holding a meeting with the USFWS staff on April 9, 2004 to discuss status of the HCP and to describe and discuss the concept of intensive management areas that would be developed on site to support the spring ecosystem species during periods of severe drought.
3) Holding a meeting with the Consultants on June 8, 2004 to discuss changes and revisions to the Draft January 2004 HCP/EIS. The changes and revisions were completed to the Draft January 2004 HCP/EIS by July 2004.
4) Reviewing the Draft July 2004 HCP/EIS by the Authority's Research and Technology Committee and the Authority's Board during meetings held in July, August and September 2004. Several amendments by Authority Board members were incorporated into the Draft July 2004 HCP/EIS.
5) Submitting the Draft July 2004 HCP/EIS, as Amended, to the USFWS, TPWD, other stakeholders and the general public for comment. Four public meetings were held by the Authority to receive public comments. These meetings were held in Victoria (November 1, 2004), New Braunfels (November 8, 2004), Uvalde (November 16, 2004), and San Antonio (November 17, 2004). In addition, a Biological Advisory Team meeting was also held on November 17, 2004 to discuss and receive comment and two facilitated meeting with major stakeholders were held February 9 and February 17, 2005.
6) Responding to comments on the Draft July 2004 HCP/EIS, as Amended. Withdrawal limits were removed from the document and the HCP was separated from the EIS. This was done because the issue of withdrawal limits are outside the control of the Authority and are not resolved at this time. Separating the HCP from the EIS was done to facilitate the review of the HCP. The EIS will be revisited, revised and included as either an integral part of the final HCP/EIS or as a stand alone document when the issues connected with withdrawal limits are resolved.
Task #4 is completed with this report.
Habitat conservation planning for development of the Edwards Aquifer Authority Habitat Conservation Plan: grant no. E-38-HP: grant program, Section 6 habitat conservation plan planning assistance
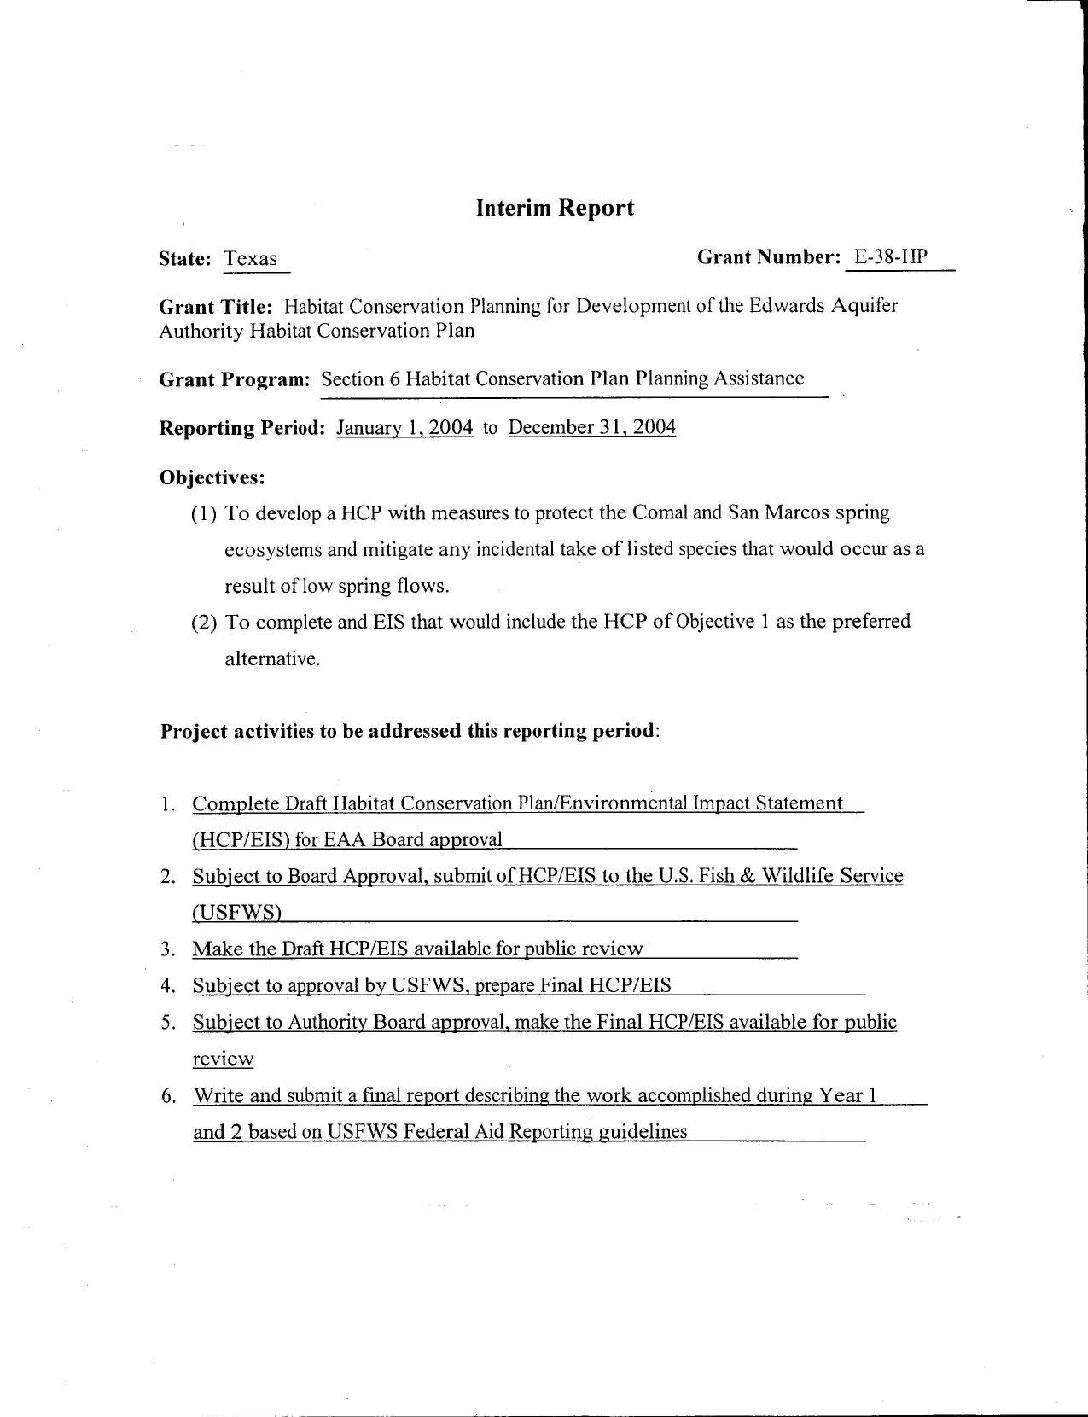
Description: Summary of progress to 2005 on development of the Habitat Conservation Plan (HCP) to protect the Comal and San Marcos spring ecosystems and mitigate any incidental take of listed species that would occur as a result of low spring flows, and Environmental Impact Statement (EIS) for description of the preferred alternative
Report Number: Grant E-38-HP
Location: Comal Springs, San Marcos Springs, Atascosa County, Bexar County, Caldwell County, Comal County, Guadalupe County, Hays County, Medina County, Uvalde County
Summary:1. Substantial changes were made to the draft HCP dated November 2002 based on comments received during 2003 from Authority staff, the HCP Work Group, Citizens Advisory Committee (CAC) and Biological Advisory Team (BAT), and results of additional modeling and evaluation studies that were also completed in 2003 and 2004.
A revised draft HCP/EIS was completed and delivered to the Authority for internal review in January 2004 (draft dated January 2004).
2. A meeting was held with USFWS staff on April 9, 2004 to discuss status of the HCP and to describe and discuss the concept of intensive management areas that would be developed on site to support the spring ecosystem species during periods of severe drought.
3. Consultants met with Authority staff on June 8, 2004, to discuss changes and revisions to the draft HCP/EIS dated January 2004, based on an intensive internal review by Authority technical and legal staff. In response to this intensive internal review additional changes and revisions were completed to the January 2004 draft HCP/EIS.
This resulted in Draft July 2004 HCP.
4. The Draft July 2004 HCP was reviewed and discussed by the Authority Board of Directors and the Board's Research and Technology Committee during several meetings held in the months of July, August and September 2004. Several amendments by Authority Board members were incorporated that resulted in the Draft July 2004 HCP, as Amended (CD included). This draft was released by the Authority Board to the general public and stakeholders for review and comments. Four public meetings were held by the Authority to receive public comment on the Draft July 2004 HCP, as amended. These meetings occurred at Victoria (November 1, 2004), New Braunfels (November 8 2004) Uvalde (November 16, 2004 ), and San Antonio (November 17, 2004 ). A BAT meeting was also held on November 17, 2004 to receive comment.
5. Public review on the Draft July 2004 HCP, as amended was still in progress at the end of 2004.
Significant Deviations
At the end of 2003, it was apparent that the complex nature of the project, the number of stakeholders with competing interests and the time required in the review and rewrite process would prevent the completion of this project in 2004. On March 16, 2004, Interlocal Agreement Contract between the Authority and State was extended through December 31, 2005.
Comprehensive and Critical Period Monitoring Program to Evaluate the Effects of Variable Flow on Biological Resources in the Comal Springs/River Aquatic Ecosystem Final 2012 Annual Report
Description: Annual report for 2012 on biota study of Comal Springs/River
Summary:[From the Executive Summary]
This annual summary report presents a synopsis of methodology used and an account of sampling activities conducted during two Comprehensive Monitoring efforts on the Comal Springs/River ecosystem in 2012. For ease of comparison, the data are reported here in an annual report format similar to previous reports (BIO-WEST 2001-2012).
The drought in Central Texas continued through 2012 and flows in the Comal River were below the historic average for the entire year. A minimum flow of 155 cubic feet per second (cfs) was reached in September, and it was the lowest minimum flow since the first year of this study (2000). With rain events few and far between, flows stayed near 200 cfs for the remainder of 2012. Although water temperatures remained constant in spring runs and Landa Lake, hot and dry conditions led to water temperatures in the mouth of Blieder's Creek that exceeded the state water quality standard for the Comal River (26.7 °C). Monitoring by Texas Master Naturalists continued to confirm that dissolved carbon dioxide (CO2) decreases and pH increases with distance from spring inputs. However, values for these parameters were similar to those observed in previous years. Recreation pressure was highest at the New Channel during the summer months, and was relatively low year-round at all other monitored sites.
Monitoring of aquatic vegetation during these prolonged droughts is important to understanding potential impacts to fountain darter (Etheostoma fonticola) habitat. Bryophytes (mosses) hold high densities of fountain darters and can be abundant within the Upper Spring Run Reach. This was the case in spring, but by fall many of the bryophytes had died likely due to shading by green algae that often bloom in summer with abundant sunlight. Sagittaria continued to be stable in the lower half of the reach. Bryophytes are also an important component of the upper section of the Landa Lake Reach.
Unlike the Upper Spring Run Reach, bryophytes at Landa Lake remained relatively constant over the entire year. Cabomba, another native plant with relatively high densities of darters has been increasing in coverage in Landa Lake, and by fall 2012 had the highest coverage observed in this study. Lower than average flows did not appear to negatively affect aquatic vegetation in the Landa Lake Reach in 2012. The Old Channel Reach exemplifies the interaction between native (Ludwigia) and non-native (Hygrophila) vegetation. Over the past several years Ludwigia has become sparse (filamentous algae is rarely present) while Hygrophila has come to dominate most of the reach. Cabomba flourished in the New Channel Reach in 2012, while coverage of Hygrophila was only slightly less in this scour-prone reach.
A high-flow event (7,280 cfs) in 2010 scoured out much of the vegetation in upper reaches of the Comal River resulting in low population estimates of fountain darters; however, by 2012 aquatic vegetation had recovered and fountain darter population estimates were similar to years prior to the flood. Estimates in the Upper Spring Run Reach decreased considerably from spring to fall due to the loss of bryophytes (which appears to be a regular cycle). These bryophytes hold the highest densities of fountain darters in the Comal River. Of non-native aquatic vegetation, Hygrophila holds the highest densities of darters.
Length-frequency distribution indicates that higher quality habitats exhibit year-round reproduction, whereas lower quality habitats (i.e., Hygrophila) typically only exhibit a spring reproductive peak. This may be tied to fountain darter spawning preferences, as other studies suggest that egg deposition in native vegetation is higher than in non-native vegetation (Phillips et al. 2011). Catches of exotic giant ramshorn snail (Marisa cornuarietis) have increased in 2011 and 2012. It is unclear if this is related to the ongoing drought, but monitoring will help determine if they are impacting aquatic vegetation. Additionally, continued monitoring of giant ramshorn snail will aid in evaluating the success of Edward's Aquifer Habitat Conservation Plan (EAHCP) measures aimed at controlling this exotic species.
Comal Springs salamander (Eurycea sp.) counts appeared to be increasing during 2012 following the post-flood decline in 2011 (the lowest during the study period). Few salamanders continue to be found at the Spring Island Spring Run, but this is likely a result of lower quality habitat compared to other reaches. A total of 749 Comal Springs Riffle Beetles (Heterelmis comalensis) were observed on cotton lures in 2012, the lowest total since 2003. Fewer have been found at Spring Island since the flood of 2010 because spring outlets have shifted locations, and riffle beetles may have moved.
The flood of 2010 impacted the biota and associated habitat in the Comal River, but monitoring efforts in 2012 indicate that much of the system has recovered. Aquatic vegetation is flourishing in all reaches, and fountain darter populations are similar to pre-flood estimates. The interaction between native and non-native vegetation will continue to be an important driver of fountain darter populations. As EAHCP efforts get under way in 2013, including aquatic vegetation restoration and non-native species control, continued monitoring is more important than ever to assess effectiveness of EAHCP activities.
Simulated Impacts Associated with the Cibolo Creek Transfers Using MODFLOW-NR and Senate Bill 3 Assumptions
Description: Tests of MODFLOW-NR and Senate Bill 3 assumptions on springflow in the Edwards Aquifer Balcones Fault Zone San Antonio Segment
Location: Edwards Aquifer, Balcones Fault Zone, San Antonio Segment
Summary:The Edwards Aquifer Authority has promulgated rules that regulate the approach by which a water producer can acquire additional water rights by purchase or by lease from other water right holders. Water right transfers from Bexar County and west into Comal and Hays Counties are referred to as Cibolo transfers because Cibolo Creek is the geographic feature between the two areas. The purpose of this study was to evaluate the impact of ground-water pumpage on aquifer water levels and springflow at Comal and San Marcos springs with the implementation of the Cibolo Transfer Rule. Using available data and the EAA MODFLOW groundwater model (with dry cell controls) to assess the impact of Cibolo transfers, the evaluation was based on five factors: geographic location relative to the springs, aquifer conditions (i.e., wet periods and drought), pumping rates of the transferred permits, critical period rules, and overall impact of the different scenarios on simulated springflow. Most of the Cibolo transfers originate in Bexar County and terminate in Comal County. Modeling results showed that permits transferred farther east have more impact on San Marcos springflow and slightly raise water levels in J-17 because pumping is shifted downgradient of J-17. Transfers may increase or decrease springflow at Comal Springs, but decrease springflow at San Marcos Springs. The decreases are exacerbated by higher summer pumping or during droughts. The study was completed on April 18, 2008 by LBG-Guyton Associates, Austin, Texas.


