
 Aquifer Conditions
Science & Data Document Library
Science and Data Resources
Report on the Effectiveness of the Edwards Aquifer Authority
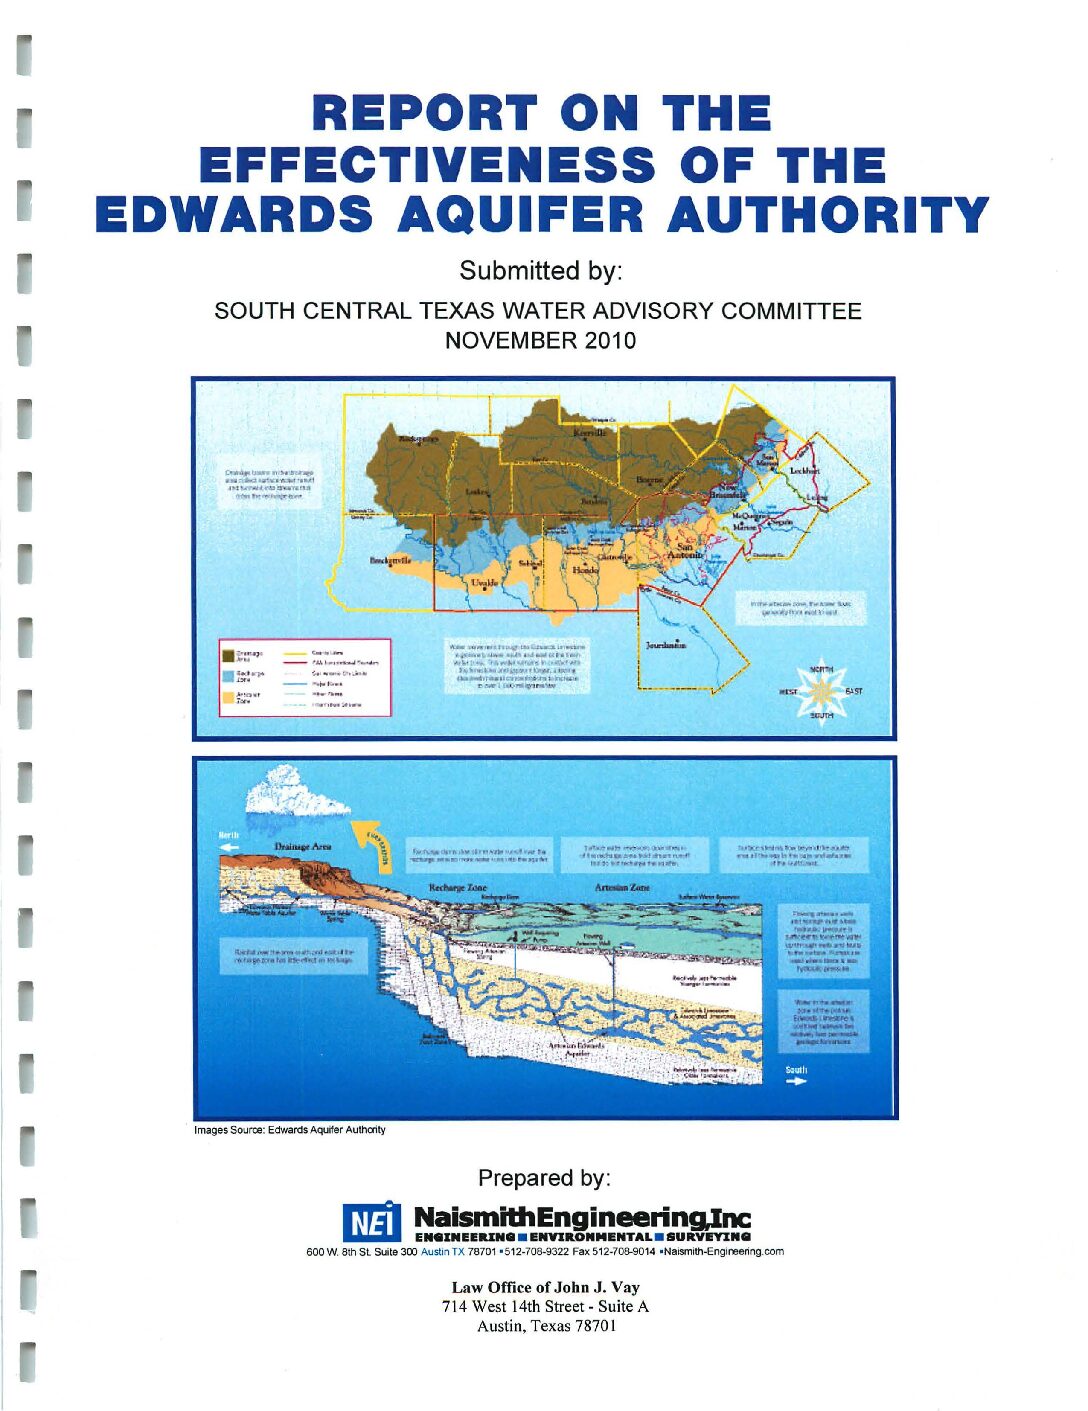
Description: Assessment of the effectiveness of the Edwards Aquifer Authority by the South Central Texas Water Advisory Committee with respect to measures established in 2008
Report Number: X: // 8415/2010 Edwards Aquifer Authority/2010 Effectiveness Report
Location: Edwards Aquifer Authority Jurisdiction
Summary:The South Central Water Advisory Committee (SCTW A C) was established by the Texas Legislature in the Edwards Aquifer Authority (EAA) Act. The SCTW AC represents downstream interests in the Guadalupe, San Antonio and Nueces River Basins and is charged with developing an Effectiveness Report on the Edwards Aquifer Authority every even numbered year and submit the report to the Texas Commission on Environmental Quality (TCEQ). The Effectiveness Report is required to assess:
1. The effectiveness of the EAA.
2. The effect on downstream water rights by the EAA management of the aquifer.
Specific points that are to be considered in this evaluation include:
*Whether the EAA has functioned as an effective organization;
*Whether the EAA has played a significant role in regional planning activities;
*Whether the EAA has complied with statutory mandates and deadlines provided in the EAA act;
*Whether the EAA has provided for effective protection of water quality in the aquifer and in contributing streams;
*Whether the EAA has achieved its water conservation goals; and
*Whether the EAA has provided effective protection of aquatic and wildlife habitat, endangered and threatened species, in-stream uses and bays and estuaries that depend on the aquifer.
The 2010 Effectiveness Report reviewed the effectiveness measures established in the 2008 report and if the EAA had met the standards established by those measures. The effectiveness measures were divided into the following areas:
*Regulatory Effectiveness Measures
*Research Effectiveness Measures
*Financial Effectiveness Measures
*Planning Effectiveness Measures
*Administrative Effectiveness Measures
*Development of a Comprehensive Public Information Plan
In general the SCTW AC concurs that the EAA met or exceeded the effectiveness measures established in the 2008 report.
Robust Representation of Dry Cells in MODFLOW
Description: Documentation and testing of MODFLOW-NR to improve method for dealing with dry cells in modeling the Edwards Aquifer
Report Number: 20-13003
Location: Edwards Aquifer, Balcones Fault Zone, San Antonio Segment
Summary:When MODFLOW calculates a water level that is below the base elevation of a computational cell, that cell is declared to be dry and removed (temporarily or permanently) from the calculation, causing the model to produce unreliable results. This problem with the MODFLOW system is well-known and long-standing. The dry-cell issue was a significant obstacle to modeling water management scenarios with the Edwards Aquifer model because cells in the recharge zone often went dry. This report describes a new variant of MODFLOW, denoted MODFLOW-NR, that incorporates a recently developed robust computational scheme for representing dry cells. The new representation of dry cells combines an upstream-weighting algorithm for intercell conductances with a new solver package. This report summarizes the capabilities, technical basis, data input requirements, software validation/verification tests, and example simulations for the MODFLOW-NR software. The study was completed in May 2007 by Southwest research Institute®, San Antonio, Texas.
The combination of upstream weighting of intercell conductances with a Newton-Raphson solver avoids numerical instabilities and artifacts associated with dry cells. Tests performed to date using the MODFLOW-NR code indicate that the approach is very robust. Comparisons with the unmodified MODFLOW-2000 code demonstrate that the upstream weighting and conventional spatial differencing approaches produce very similar results.
Version 1.0 of MODFLOW-NR is limited to single-layer aquifers. However, the approach is applicable to aquifers with multiple layers. Fully three-dimensional capabilities could be added to future versions with a reasonable level of effort.
MODFLOW-NR has been tested with the Well, Drain, Recharge, River and Horizontal Flow Barrier packages. The recently developed Well Pumping Management Package (WMP1) is not included in Version-1 of MODFLOW-NR, but could be incorporated in future versions.
Additional Graphical Materials to the Edwards Aquifer (San Antonio Region) Groundwater Flow Model (Lindren et al., 2004)
Description: Visual output for flowpath simulation, steady-state and transient water level residuals, and water-level root mean square error distributions for target wells using MODFLOW/GWSIM models and data from Lindgren et al, 2004
Location: Edwards Aquifer, Balcones Fault Zone, San Antonio Segment
Summary:1. MODPATH particle trace (flowpath) simulation using a MODFLOW numerical solution for September 1956.
2. Steady-state and transient water level residuals for the MODFLOW Edwards Aquifer groundwater flow model.
3. Comparison between water-level root mean square error (RMSE) distributions for target wells used in the MODFLOW and GWSIM models.
Edwards Aquifer Authority Technical Documents Project Phase II
Description: Documentation of Phase II of the Edwards Aquifer Authority Technical Documents Project from 2012-2014
Location: Edwards Aquifer Authority Jurisdiction
Summary:This is the continuation and completion of the Edwards Aquifer Authority (EAA) Technical Documents Project, which began in 2012 and was documented in the Phase I Report (Dabney, 2012). In addition to discovering, digitizing, indexing and uploading the remaining EAA Technical Documents, Phase II also included two other projects:
- Performing a similar process for the documents comprising the record of the EAA Recovery Implementation Plan and Environmental Impact Statement which led to the adoption of the Habitat Conservation Plan by the U.S. Department of the Interior Fish and Wildlife Service (http://eahcp.org/), and also:
- A detailed Quality Control assessment of the EAA on-line Scientific Reports Documents Library on the new EAA website (https://www.edwardsaquifer.org/scientific-research-and-reports/scientific-reports-document-library).
Edwards Aquifer Authority Aquifer Science Research Program Plan 2008-2013
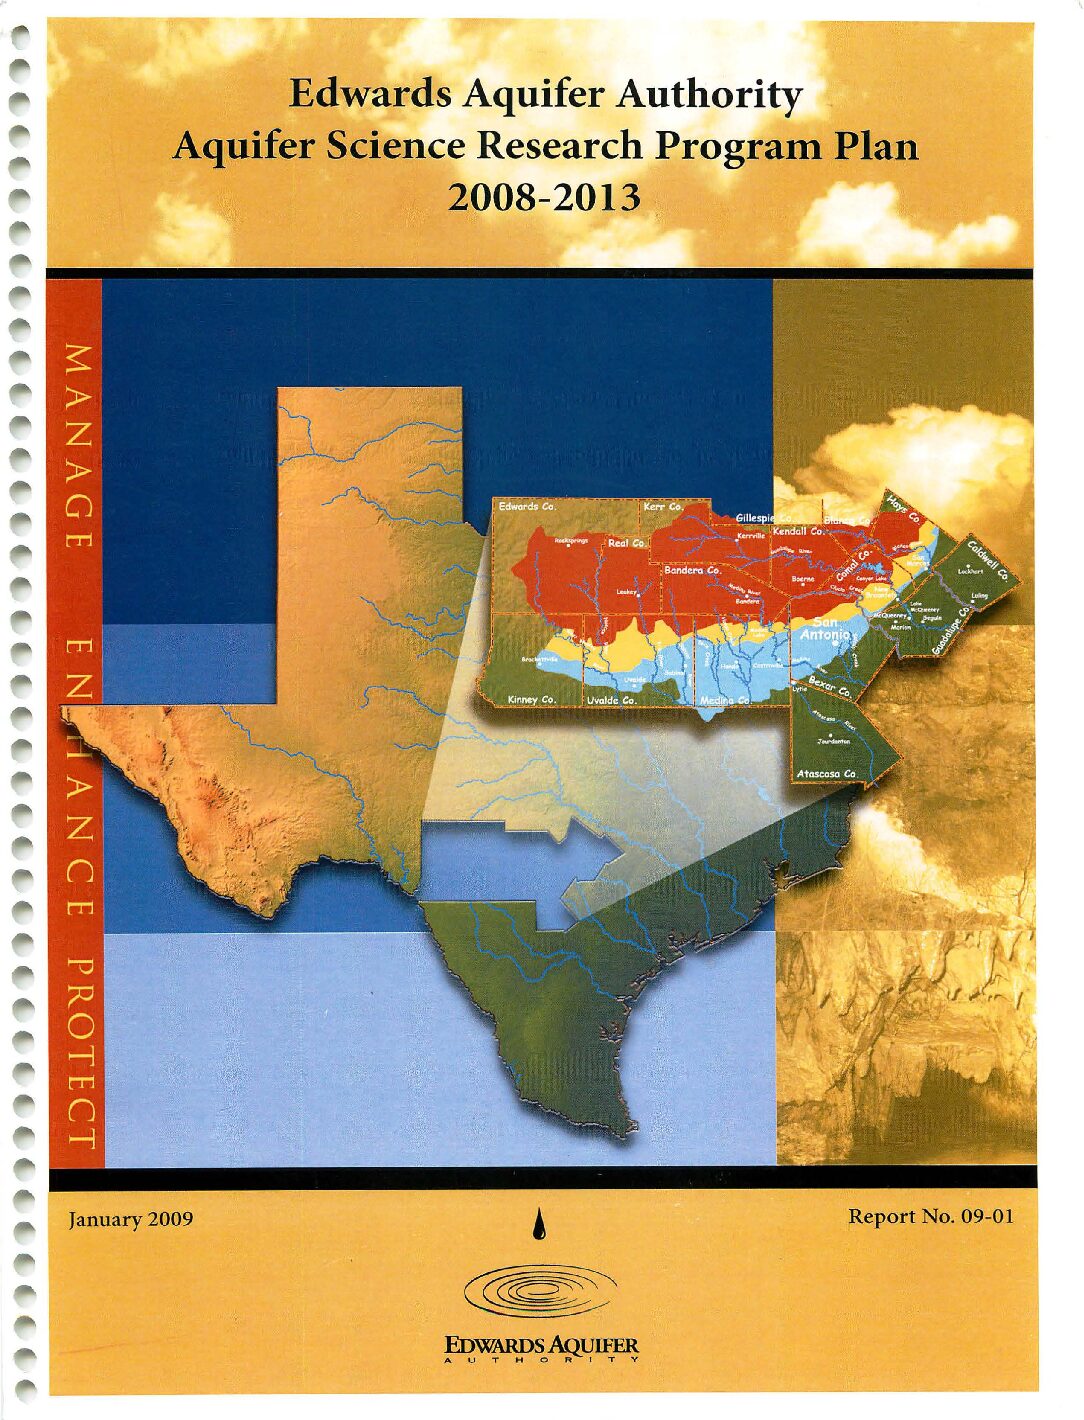
Description: Edwards Aquifer Authority Aquifer Science Research Program Plan for 2008-2013
Report Number: 1-Sep
Location: Edwards Aquifer Authority Jurisdiction
Summary:The Edwards Aquifer is a complex system, and to understand the aquifer adequately requires accurate and timely research and data collection. This report summarizes the inception of the Authority's Aquifer Science Research Program {ASRP), which is a natural outgrowth of the Authority's former research program known as Optimization Technical Studies (OTS). The OTS were performed under the Edwards Aquifer Optimization Program (EAOP) as summarized by Todd Engineers, 1999.
The ASRP is managed by the Authority with input from an outside panel of experts referred to as the Aquifer Science Advisory Panel (ASAP), as well as continued input from the Technical Advisory Group (TAG), which helped the Authority develop the
original OTS. The ASRP differs from the OTS in that the Authority received input from the TAG and the ASAP in relation to research project development and review. The ASRP is also limited to research projects related directly to the Authority's Aquifer Science Program, whereas the OTS included projects outside the scope of the Aquifer Science Program. The Authority's board of directors has final approval over all projects prior to initiation.
The Edwards Aquifer Authority Aquifer Science Research Program Plan 2006-2011 {ASRPP-2006), which was released in November 2006, documents the Authority's transition from the OTS to the ASRP. The Aquifer Science Research Program Plan 2008-2013 (ASRPP-2008), the first update and revision to the ASRPP-2006, contains information on the status of existing research programs, as well as new research initiatives.
In order for the various projects associated with the ASRP to be documented, summary tables are provided in each section, whereas detailed descriptions are provided in the appendices. Appendix A provides detailed descriptions of proposed and active ASRP projects (some of which began as OTS projects), and completed projects (ASRP and OTS) are summarized in Appendix B.
Edwards Underground Water District: Created to Conserve, Protect and Preserve the Edwards Aquifer
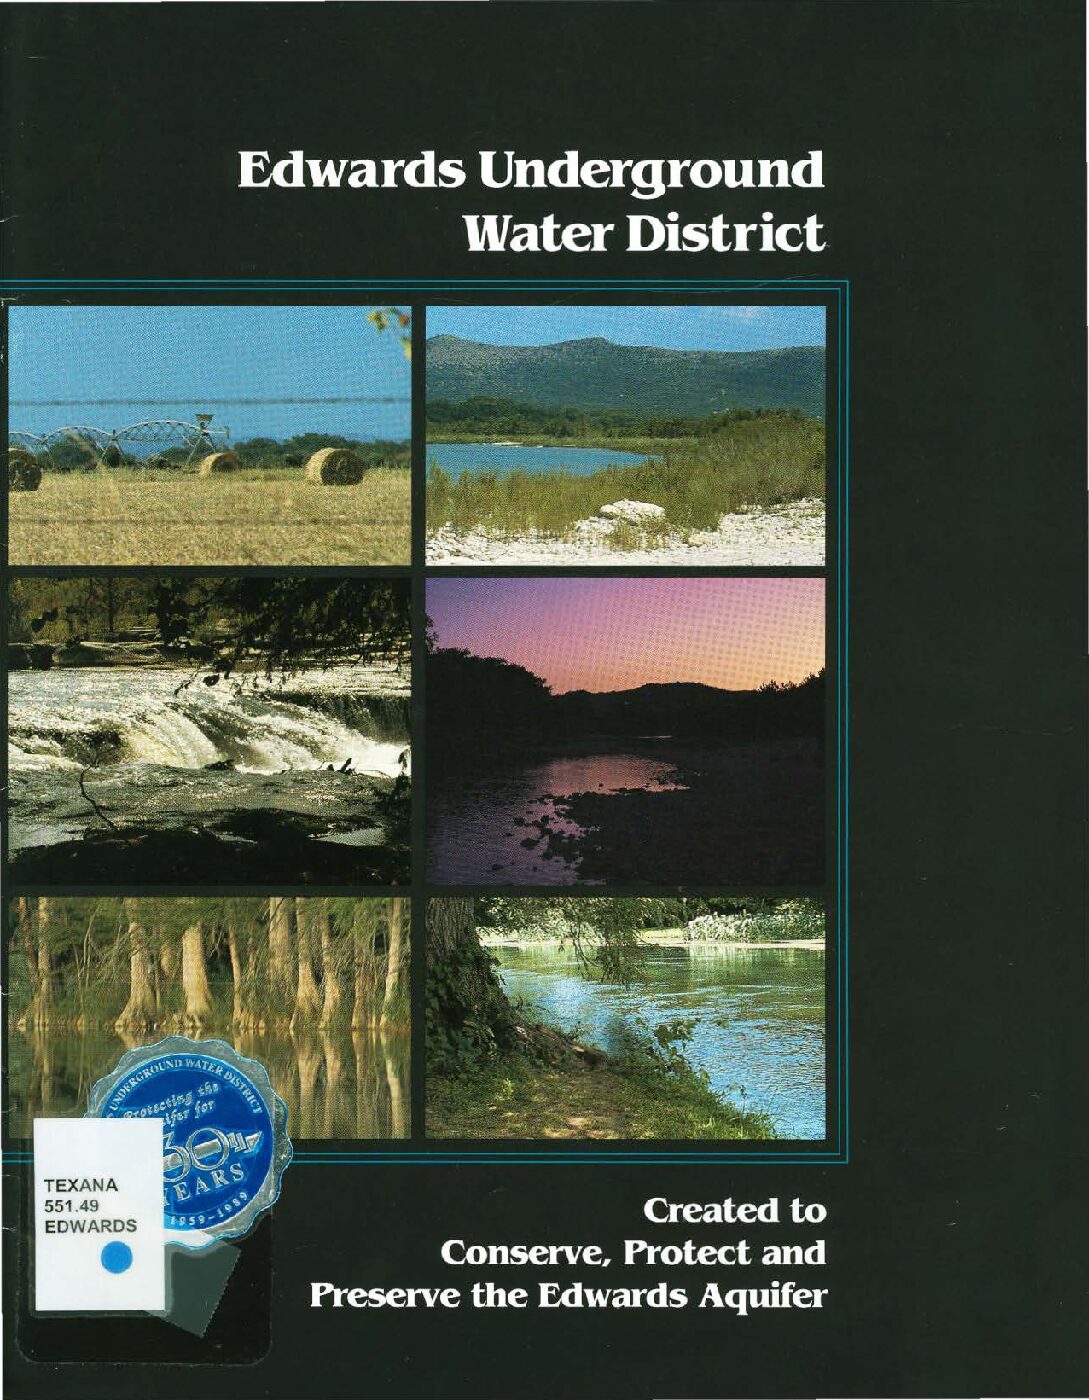
Description: History and overview of the Edwards Aquifer and the Edwards Underground Water District
Location: EUWD Jurisdiction
Summary:Ground water is one of Texas' most valuable resources. About 70% of the water currently used in Texas is ground water. Recognizing the significance of this resource, the state took steps to provide for the protection of ground water through the enactment of the Underground Water Conservation Districts Act in 1949. The Act provided for the creation of underground water districts as a means of local self-government and management of water resources.
The state also enacted legislation establishing special law districts for the protection and conservation of ground water resources in particular regions. One such special law is the enabling statute of the Edwards Underground Water District (EUWD).
The Edwards Underground Water District was created in 1959 to conserve, protect and preserve the Edwards Aquifer.
One of the most productive aquifers in the southwestern United States, it currently supplies high-quality water to over one million people for municipal, industrial, agricultural and recreational purposes. Since its creation, the EUWD has been fulfilling its responsibilities by undertaking programs for monitoring water quality, enhancing aquifer recharge and encouraging conservation. The District has also led efforts to plan for water resources of the aquifer region.
Edwards Aquifer Authority Technical Documents Project Phase I
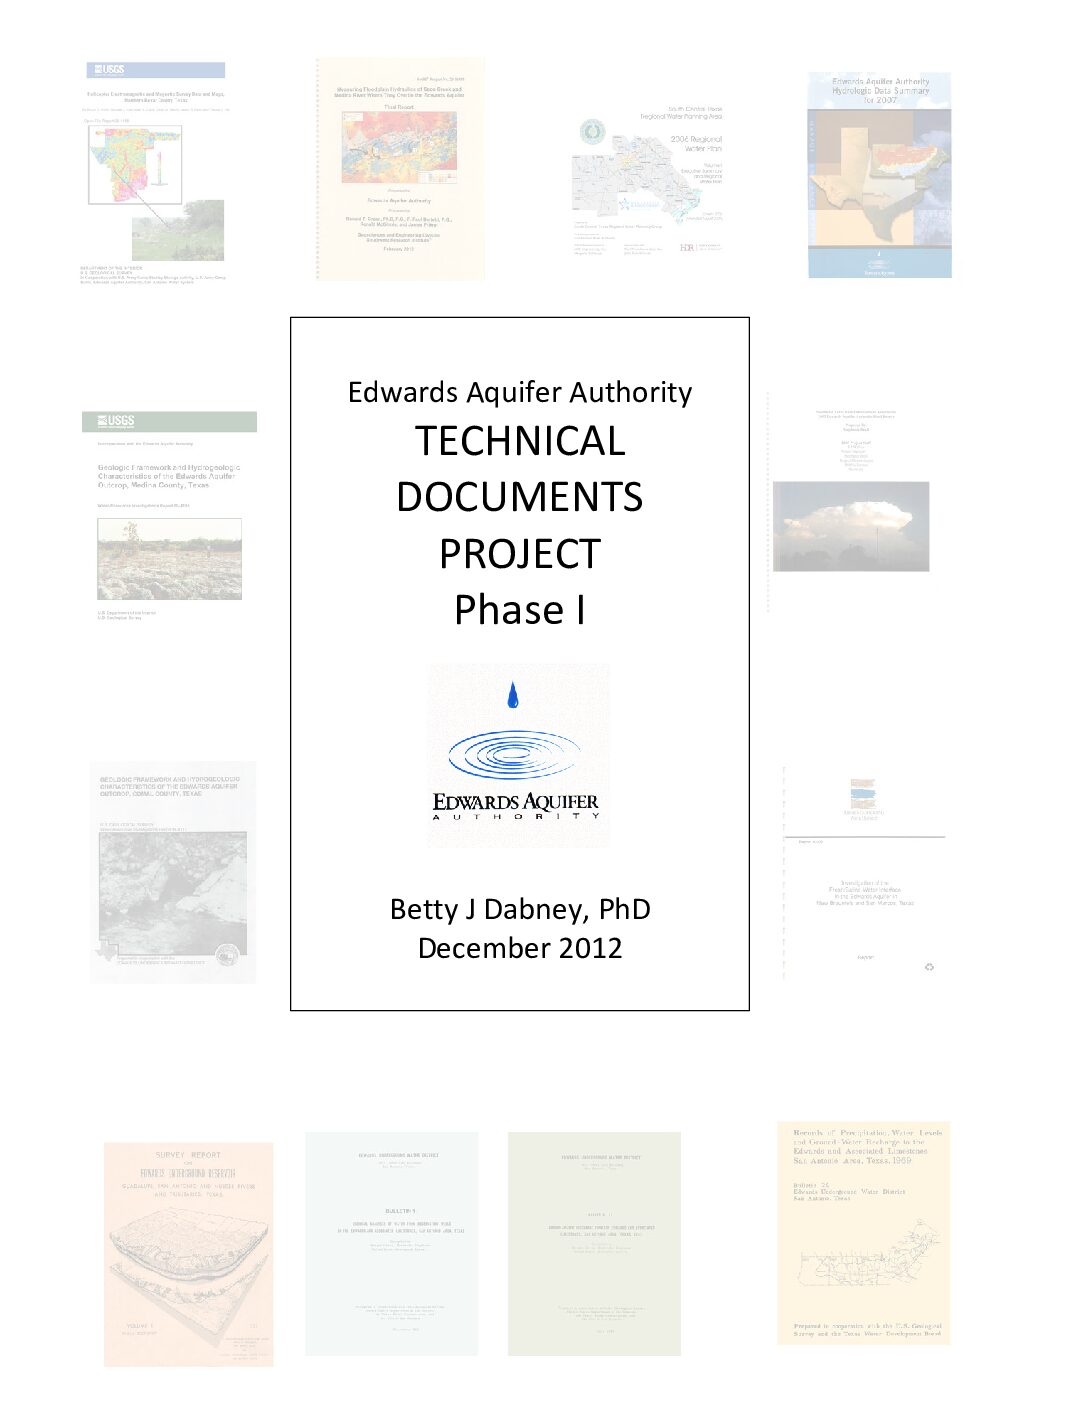
Description: Documentation of Phase I of the Edwards Aquifer Authority Technical Documents Project from 2011-2012
Location: Edwards Aquifer Authority Jurisdiction
Summary:The Edwards Aquifer Authority (EAA) and its predecessor, the Edwards Underground Water District (EUWD), have developed an impressive body of scientific research and technical studies on the Aquifer over a period of many years. This Science & Research (S&R) Program has been necessary in order to develop an understanding of the geography, hydrogeology, capacity and behavior of the Aquifer and its associated springs and wells under a variety of climatic conditions and uses.
As the major source of drinking water for two million people, the Edwards Aquifer is in an unusual position of being highly susceptible to natural and anthropogenic pollution as a result of extensive development over its Drainage and Recharge Zones. In the interest of transparency and to make these extensive data available to other researchers and to the general public alike, the EAA undertook this Technical Documents Project.
The purposes of the Technical Documents Project were:
To discover the legacy Technical and Scientific Reports of the Edwards Aquifer Authority that may exist in various places, either in hard copy or in electronic format;
To digitize these documents, including thumbnail graphic images of the report covers, and convert them for Optical Character Recognition;
To develop a new document classification system and reach consensus with the S&R Team on it;
To put the documents on the EAA website in some kind of organized fashion, with Summaries, Descriptions, Keywords, Abstracts, and other identifiers in order to enhance the browsing and searching experience of the visitors to the website; and finally,
To standardize the way the S&R Documents are entered, classified and organized on the EAA website and its server.
At first it became apparent that the documents were spread out in many places. Many, but not all, were archived in the EAA Library. Some were in individual scientists' offices and computers. Some were already on the EAA website but were in various places, were difficult to find, and were duplicated under different document titles. No one really knew how many documents there were. And as a result, it would be impossible to know when all the documents had been identified or how long this would take.
Of the 383 documents found, 274 were selected for inclusion in Phase I, and 246 have been scanned or downloaded. The remainder are already on the EAA website, are of lower priority or have not been obtainable.
More documents were discovered and added in Phase II from 2013-2014 and will be discussed in a separate report.
The Edwards Underground Water District and Edwards Underground Reservoir
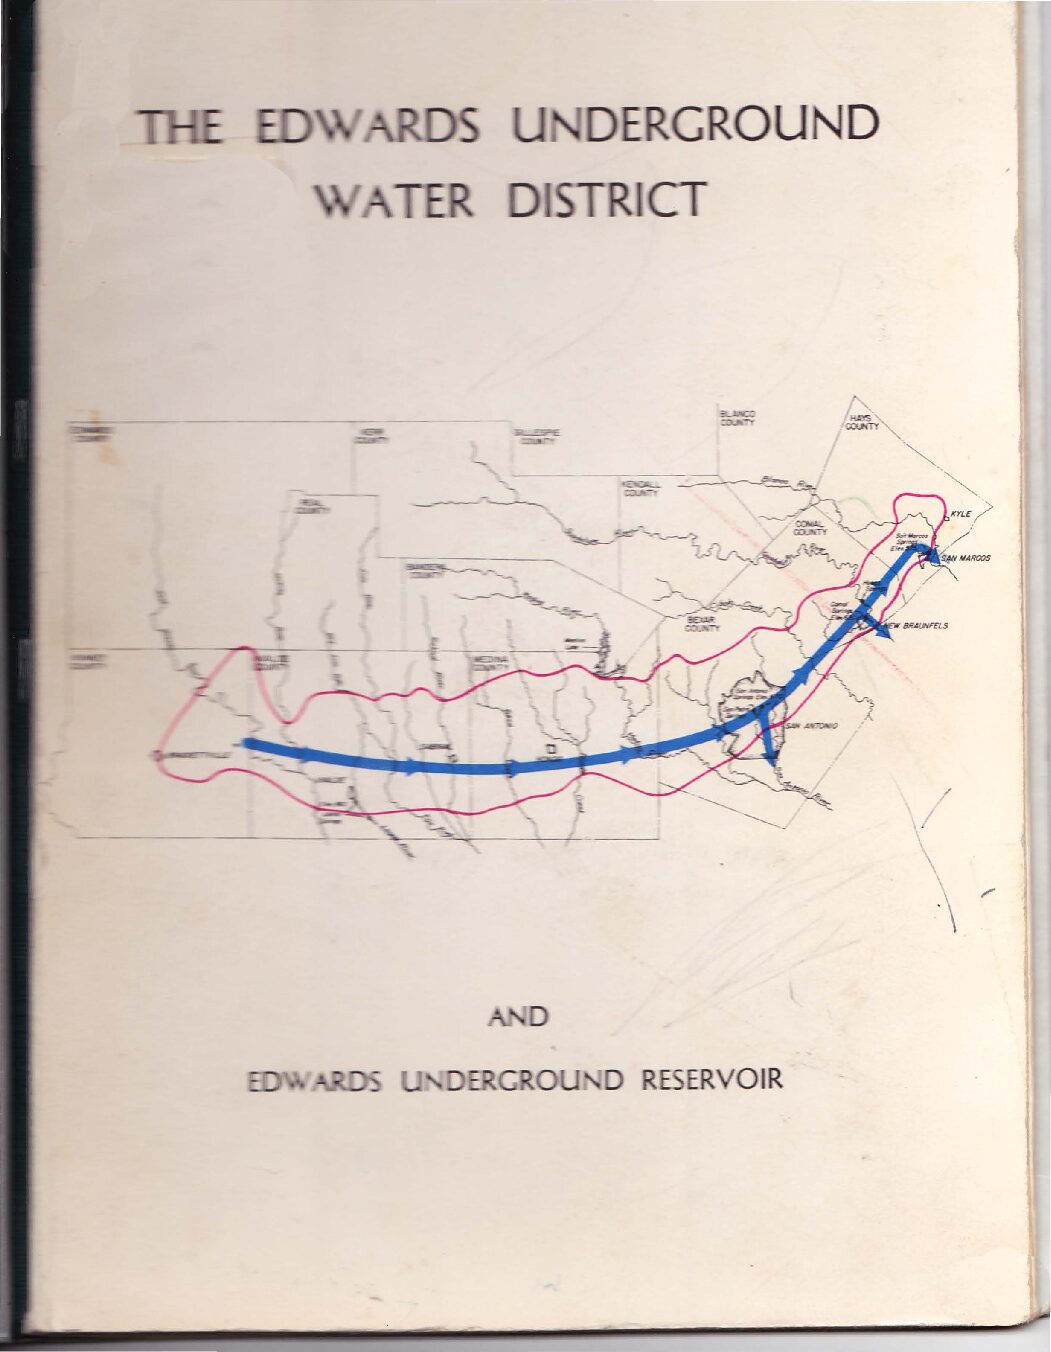
Description: Description of the Edwards Underground Water District and Reservoir. Note: This document is included for its historical value. Note: There is another document with the same title but different content.
Location: Edwards Aquifer, Balcones Fault Zone, San Antonio Segment
Summary:Description of the Edwards Underground Water District and Reservoir.
Note: This document is included for its historical value.
Note: There is another document with the same title but different content.
Edwards Aquifer Bibliography through 2010
Description: Bibliography of the Edwards Aquifer through 2010
Location: Edwards Aquifer and Environs
Summary:This bibliography comprises multidisciplinary references to technical and general literature for three regions of the aquifer in Texas the San Antonio segment; the Barton Springs segment, Austin area; and the northern segment, Austin area. The references in this bibliography are compiled from computerized data bases, published bibliographies, and reports. Dates of references range from the late 1800's through 2010.
The Water Source
Description: Features and summaries of news and scientific studies published by the Edwards Underground Water District from 1989-1996
Location: Edwards Aquifer, Balcones Fault Zone, San Antonio Segment
Summary:Features and summaries of news and scientific studies published by the Edwards Underground Water District from 1989-1996
HSPF Recharge Models for the San Antonio Segment of the Balcones Fault Zone of the Edwards Aquifer Part 3

Description: Development of complete contributing and recharge zones for the HSPF enhancement to MODFLOW from historical data on all nine drainage basins of the Edwards Aquifer Balcones Fault Zone San Antonio Segment - Part 3
Report Number: 02-87-AS
Location: Edwards Aquifer, Balcones Fault Zone, San Antonio Segment, Contributing Zone, Recharge Zone
Summary:Note: This document is Part 3 of 3 parts.
The purpose of this study was to develop a new method for estimating recharge to the Edwards Aquifer. The computer program Hydrologic Simulation Program Fortran (HSPF) was used to develop a comprehensive recharge estimation model for the region. A previously completed pilot study project modeled portions of two of the nine basins applicable to the Edwards Aquifer. The pilot study indicated HSPF as a viable tool for recharge estimation and led to the initiation of this project. This project developed recharge models for all nine basins relevant to the Edwards Aquifer, by modeling the upstream (drainage) area, as well as the recharge zone of the aquifer. The project was completed in March 2005 by LBG Guyton Associates, Inc., Austin, Texas.
[From the Executive Summary]
Hydrologic models have been developed for the nine basins that recharge the San Antonio section of the Edwards Aquifer and recharge estimates from these models have been implemented into recharge data for the Edwards Aquifer MODFLOW model. The models have been calibrated for the basins of the (1) Nueces/West Nueces Rivers, (2) Frio/Dry Frio Rivers, (3) Sabinal River, (4) area between Sabinal and Medina River (Seco and Hondo Creeks), (5) Medina River, (6) area between Medina and Cibolo (San Geronimo, Helotes, and Salado Creeks), (7) Cibolo/Dry Comal Creeks, (8) Guadalupe River, and (9) Blanco River.
The main objective of the project was to develop hydrologic simulation models for the entire contributing and recharge zone of the Edwards Aquifer with the main focus being to estimate historical recharge to the Edwards Aquifer from 1950 through 2000. In addition to estimating
recharge, secondary objectives of the project were to ensure that the models were compatible with the future goals of assessing issues important to the Authority and other stakeholders, including water quality, land use changes, weather modification, brush control, recharge dams, and flood control. To achieve these goals, the entire contributing zone (above the Edwards aquifer recharge zone) of each of the nine basins was incorporated into the models.
The HSPF models are valuable tools for simulating the hydrology of the nine basins and assessing recharge under various hydrologic conditions. The models provide a new tool for assessing hourly hydrology, which could not be done with the traditional methods. They simulate each basin more discretely than the traditional methods do; which makes the models more appropriate for evaluating recharge enhancement, water quality and many other technical and regulatory issues.
To improve the accuracy of the models, more detailed field studies should be completed in selected areas of the recharge zone. These assessments should include field-scale rainfall-runoff and evaporation studies, tracer studies, channel loss studies, and other evaluations. Suggested model improvements include incorporating more detailed precipitation data from Authority rain gages that has been collected since this study was initiated; estimating model parameters by developing models for smaller watersheds; and enhancing the existing models to simulate water quality.
Summary Information Regarding Historical Edwards Aquifer Recharge, Aquifer Modeling and Recharge Enhancement Projects
Description: Compilation of historical reports by HDR Engineering on recharge and modeling of the Edwards Aquifer Balcones Fault Zone San Antonio Segment
Location: Edwards Aquifer, Balcones Fault Zone, San Antonio Segment, Recharge Zone
Summary:Compilation of historical reports by HDR Engineering on recharge and modeling of the Edwards Aquifer Balcones Fault Zone San Antonio Segment
HSPF Recharge Models for the San Antonio Segment of the Balcones Fault Zone of the Edwards Aquifer Part 2
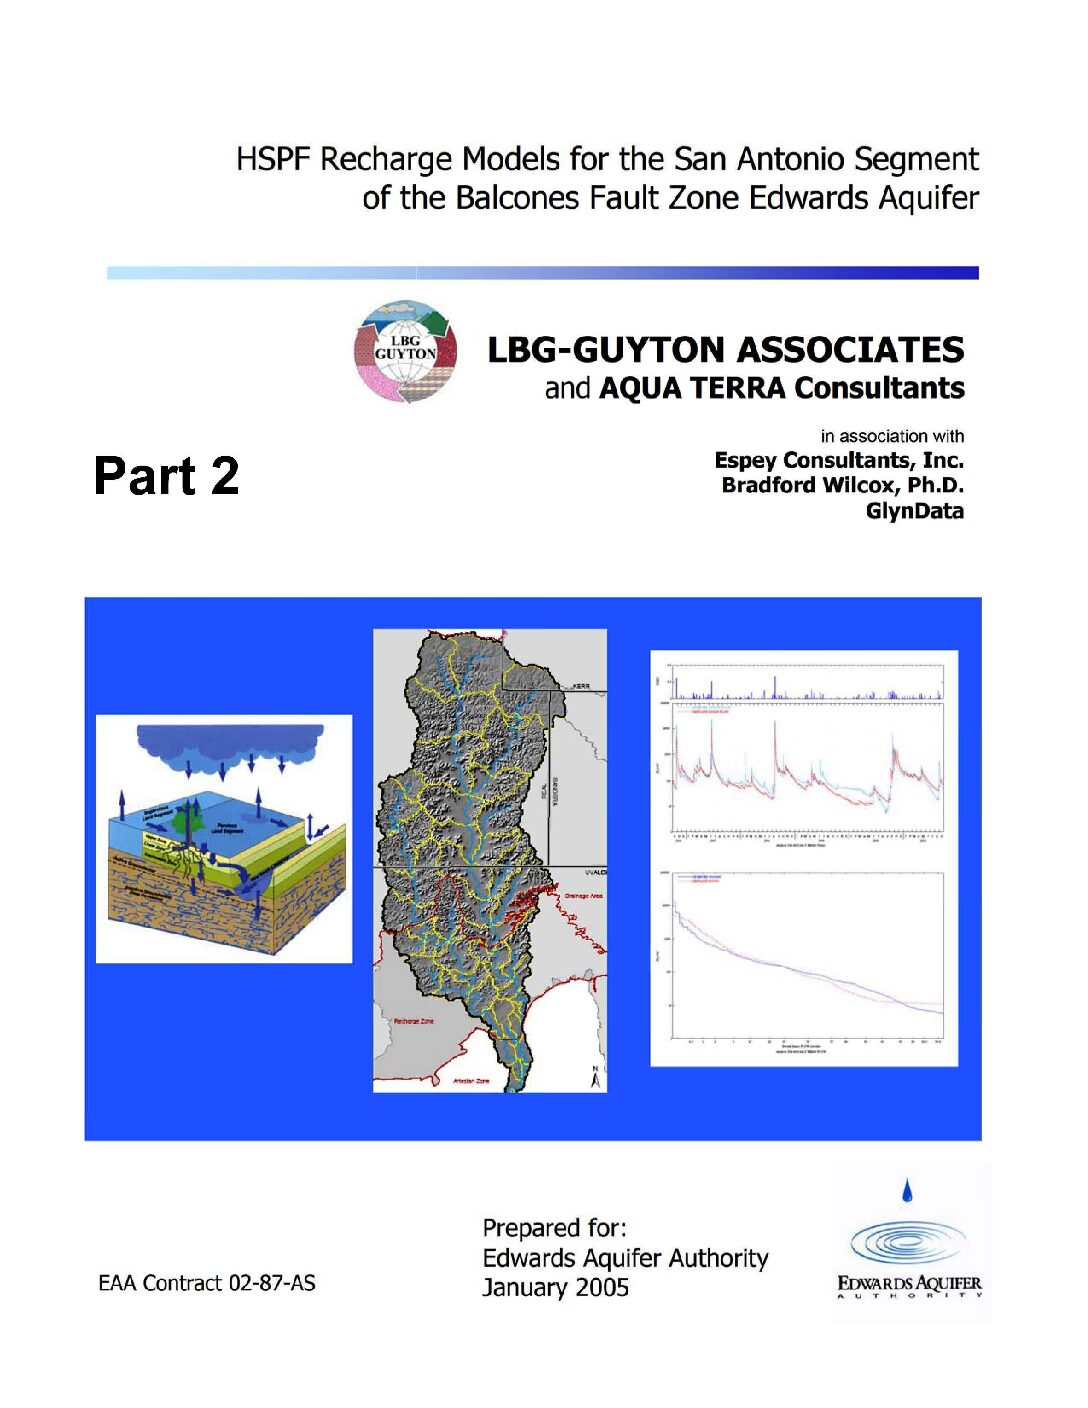
Description: Development of complete contributing and recharge zones for the HSPF enhancement to MODFLOW from historical data on all nine drainage basins of the Edwards Aquifer Balcones Fault Zone San Antonio Segment - Part 2
Report Number: 02-87-AS
Location: Edwards Aquifer, Balcones Fault Zone, San Antonio Segment, Contributing Zone, Recharge Zone
Summary:Note: This document is Part 2 of 3 parts.
The purpose of this study was to develop a new method for estimating recharge to the Edwards Aquifer. The computer program Hydrologic Simulation Program Fortran (HSPF) was used to develop a comprehensive recharge estimation model for the region. A previously completed pilot study project modeled portions of two of the nine basins applicable to the Edwards Aquifer. The pilot study indicated HSPF as a viable tool for recharge estimation and led to the initiation of this project. This project developed recharge models for all nine basins relevant to the Edwards Aquifer, by modeling the upstream (drainage) area, as well as the recharge zone of the aquifer. The project was completed in March 2005 by LBG Guyton Associates, Inc., Austin, Texas.
[From the Executive Summary]
Hydrologic models have been developed for the nine basins that recharge the San Antonio section of the Edwards Aquifer and recharge estimates from these models have been implemented into recharge data for the Edwards Aquifer MODFLOW model. The models have been calibrated for the basins of the (1) Nueces/West Nueces Rivers, (2) Frio/Dry Frio Rivers, (3) Sabinal River, (4) area between Sabinal and Medina River (Seco and Hondo Creeks), (5) Medina River, (6) area between Medina and Cibolo (San Geronimo, Helotes, and Salado Creeks), (7) Cibolo/Dry Comal Creeks, (8) Guadalupe River, and (9) Blanco River.
The main objective of the project was to develop hydrologic simulation models for the entire contributing and recharge zone of the Edwards Aquifer with the main focus being to estimate historical recharge to the Edwards Aquifer from 1950 through 2000. In addition to estimating
recharge, secondary objectives of the project were to ensure that the models were compatible with the future goals of assessing issues important to the Authority and other stakeholders, including water quality, land use changes, weather modification, brush control, recharge dams, and flood control. To achieve these goals, the entire contributing zone (above the Edwards aquifer recharge zone) of each of the nine basins was incorporated into the models.
The HSPF models are valuable tools for simulating the hydrology of the nine basins and assessing recharge under various hydrologic conditions. The models provide a new tool for assessing hourly hydrology, which could not be done with the traditional methods. They simulate each basin more discretely than the traditional methods do; which makes the models more appropriate for evaluating recharge enhancement, water quality and many other technical and regulatory issues.
To improve the accuracy of the models, more detailed field studies should be completed in selected areas of the recharge zone. These assessments should include field-scale rainfall-runoff and evaporation studies, tracer studies, channel loss studies, and other evaluations. Suggested model improvements include incorporating more detailed precipitation data from Authority rain gages that has been collected since this study was initiated; estimating model parameters by developing models for smaller watersheds; and enhancing the existing models to simulate water quality.
Method of Estimating Natural Recharge to the Edwards Aquifer in the San Antonio Area, Texas
Description: US Geological Survey method of estimating recharge in the Edwards Aquifer Balcones Fault Zone San Antonio Segment
Report Number: USGS WRIR 78-10
Location: Edwards Aquifer, Balcones Fault Zone, San Antonio Segment
Summary:Estimates of annual recharge to the Edwards aquifer in the San Antonio area, Texas, have been made by several investigators as part of the long-term studies of the aquifer by the U.S. Geological Survey under agreements with several local cooperators .
The method of estimating annual recharge is based on data collected from a network of stream-gaging stations and on assumptions related to applying the runoff characteristics from gaged areas to ungaged areas.
The basic approach is a water-balance equation, in which recharge within a stream basin is the difference between measured streamflow above and below the infiltration area of the aquifer plus the estimated runoff in the zone that includes the infiltration area. Recharge in the Medina River basin also includes seepage losses from Medina Lake and Diversion Reservoir.
Gaging stations are located above and below the infiltration area in five of the nine basins that have .been delineated. Gaging stations above and below the infiltration area are located in parts of the other four basins. Parts of two basins have stations only at points below the infiltration area, and parts of the other two basins have no gaging sites at all.
The principal errors in the estimates of annual recharge are related to errors in estimating runoff in ungaged areas, which represent about 30 percent of the infiltration area. The estimated long-term average annual recharge in each basin, however, is probably representative of the actual recharge because the averaging procedure tends to cancel out the major errors.
Edwards Aquifer Authority Rain Gauge Analysis Study Report
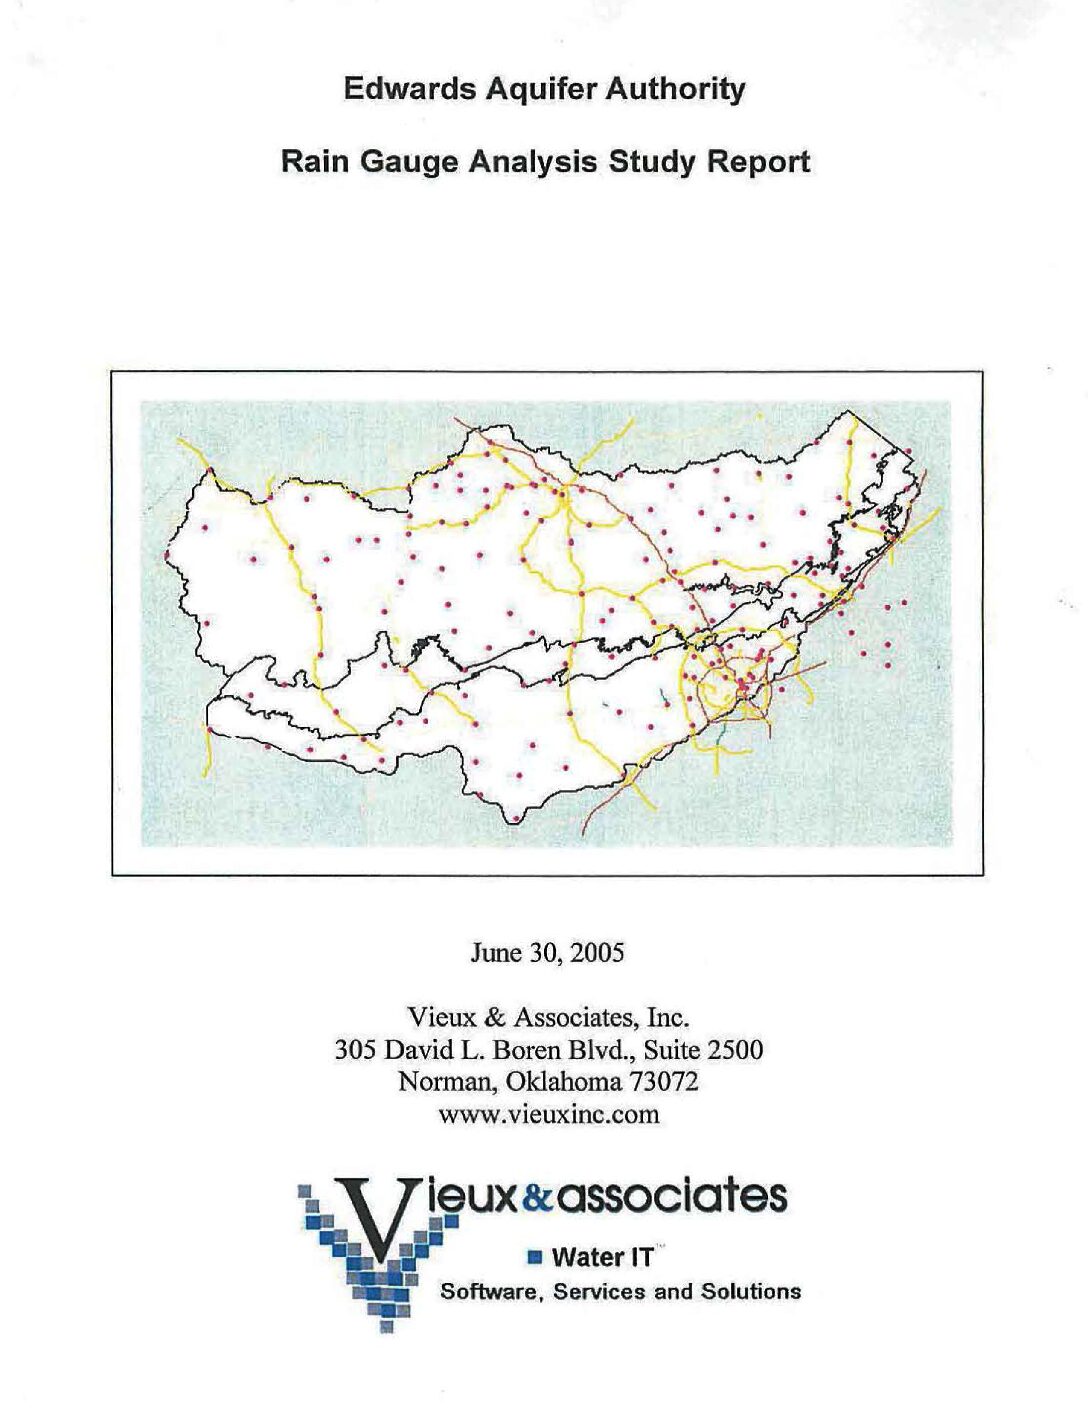
Description: Recommendations for optimizing placement of rain gauges in the Edwards Aquifer area
Location: Edwards Aquifer, Balcones Fault Zone, San Antonio Segment
Summary:The purpose of this report is to identify improvements to the rain gauge network that will increase the usefulness and accuracy of rainfall monitoring over the Edwards Aquifer Area (EAA). The proposed rain gauge networks are intended to provide more evenly distributed coverage over the aquifer area and for use in radar calibration. The existing gauge network of 61 EAA gauges in combination with the 41 gauges in the Guadeloupe [sic] Blanco River Authority (GBRA) network provides an average density of one gauge per 87 mi2 and a mean inter-gauge spacing that varies from 7 to 15 mi2 depending on the zone. Some zones, such as the Artesian Zone, have fewer gauges than other zones. Proposed new gauge locations are confined to easily accessible roadway locations to reduce access and operations costs.
The proposed rain gauge network achieves a density of one gauge per 66 mi2 with a uniform inter-gauge spacing of 8 mi2. An Alternative Configuration that relies on a private network of gauges achieves an improved density of one gauge per 55 mi2 with higher densities in and around San Antonio. Using the private network requires fewer new gauges to be installed. With the proposed additional gauges, more uniform coverage among zones, increased gauge density, and reduced inter-gauge spacing is achieved. With the addition of gauges, improvement in radar rainfall accuracy will be greatest in areas where few gauges existed. Analysis of the historical rain gauge performance revealed which gauges could be improved through maintenance actions. Correcting the twenty-one gauges rated as Suspect or Poor would help improve one-third of the existing gauges in the rain gauge network (RGN). The recommended maintenance actions and adjustments to the gauge network configuration will improve the quality and usefulness of the rain gauge data and benefit the accuracy of radar rainfall.


